Viewing and Editing Code
Plotly Studio apps are powered by Dash, Plotly's Python framework. When you make changes to a Plotly Studio app by updating prompts, Plotly Studio regenerates this underlying Dash app code. Although you don't need to know how to code to use Plotly Studio and can make changes using natural language, you can also make changes directly to the app code.
The code in a Plotly Studio app uses Dash, Plotly.py, Dash Design Kit, as well as third-party Python libraries like Pandas.
Code structure
When Plotly Studio generates an app, it generates code in modules:
-
Layout: Imports all other components, for example, individual charts and filters, and defines the order of these components. This module also contains the app title, description, and hero component.
-
Theme: Dash Design Kit theme file that defines the colors and styles that the app uses.
-
Filter Component: Renders the global filter controls displayed at the top of the generated app. It returns filtered data to data cards and charts.
- Data Cards: Renders Dash Design Kit DataCard components, which are useful for highlighting important KPIs and at-a-glance statistics.
- Charts: Renders Plotly.py charts using the Dash Design Kit Graph component,
ddk.Graph.
Updating the code
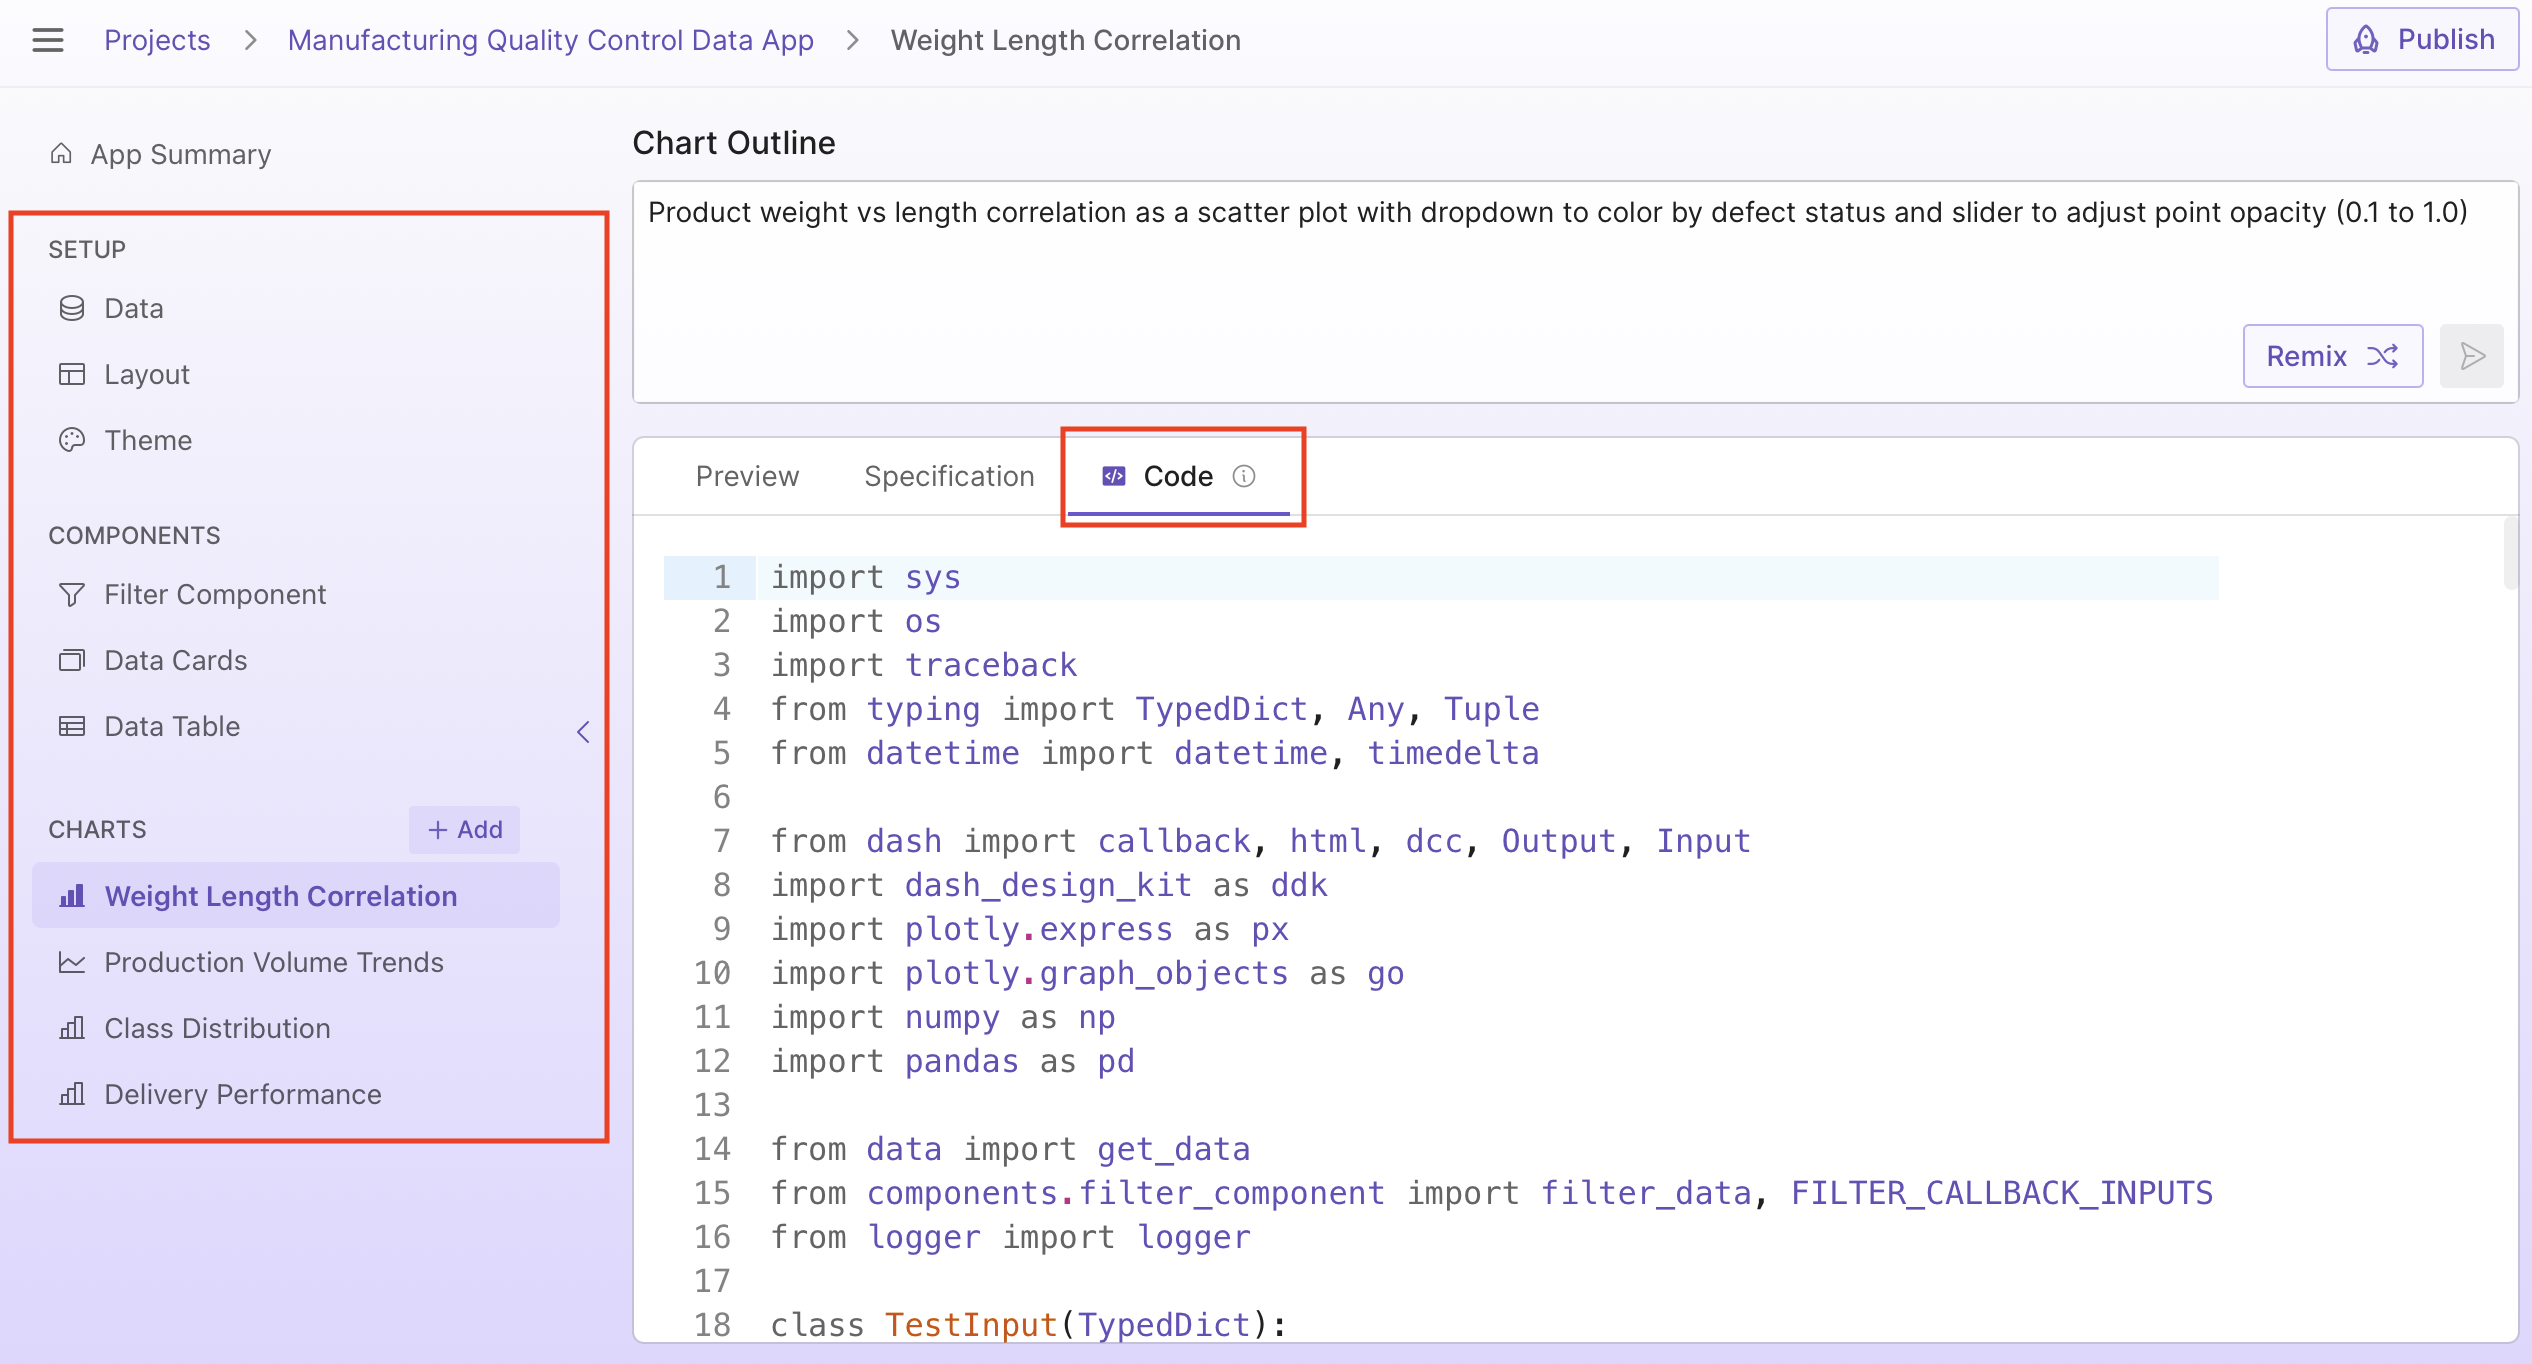
To update code, select a component, chart, or one of the setup modules from the sidebar and select the Code tab:
Make your desired changes and then select Save:
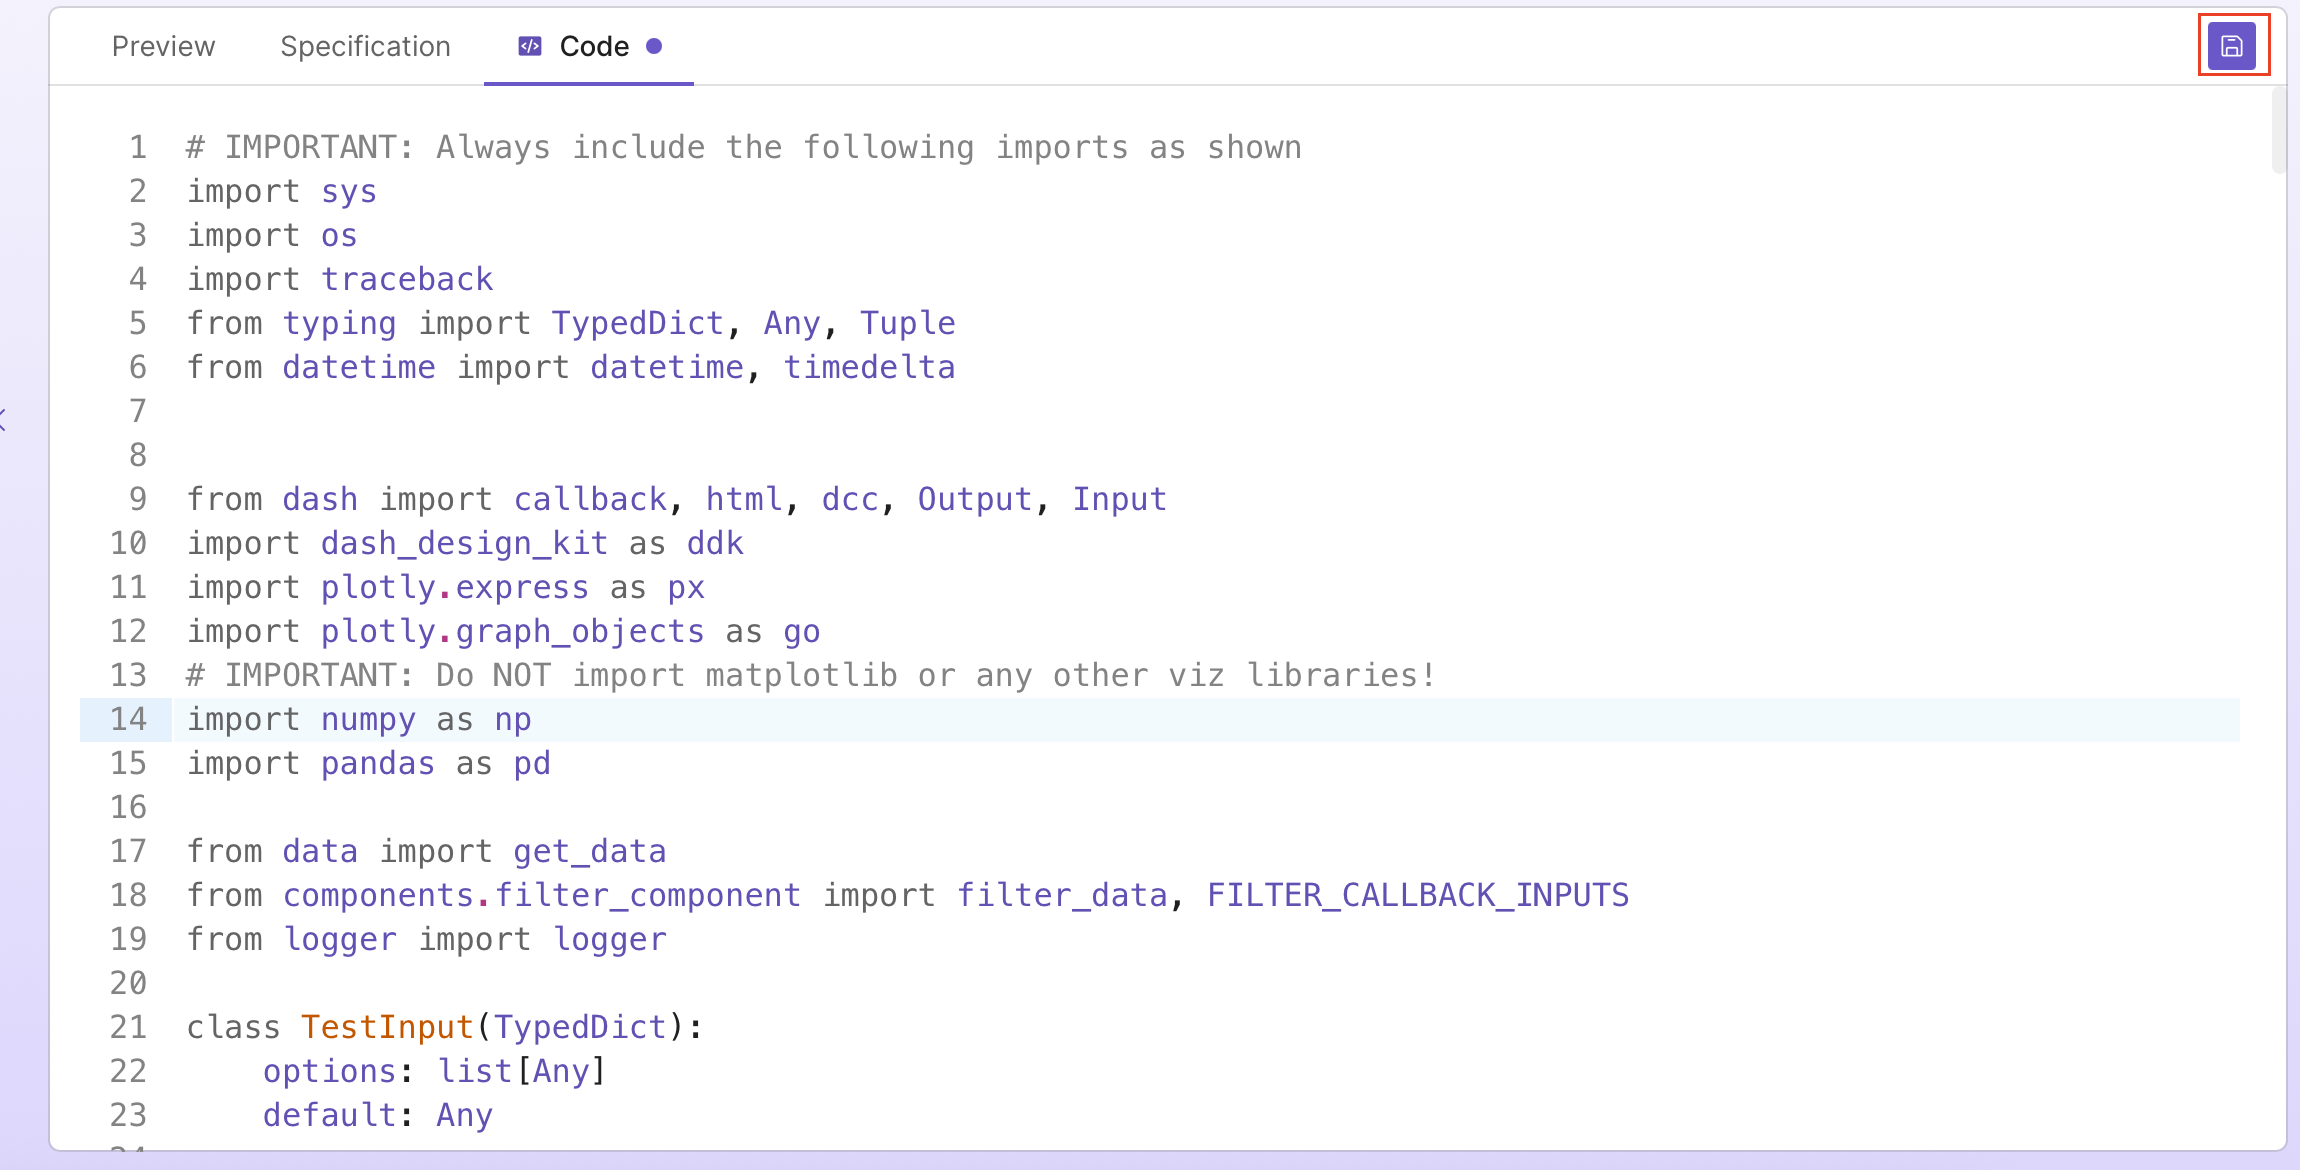
When you save a code change, Plotly Studio regenerates the module specification to reflect the changed code and updates the preview.
Plotly Studio apps have access to the following Plotly and third-party packages, and you can use these when making code updates:
dashdash-ag-griddash-design-kitnarwhalsnumpypandasplotlypydanticrequestsstatsmodels
Info
Avoid adding data directly in your app code. The code gets sent to the LLM with each request and can overload its limited context window.
Logs
Logs are messages emitted from the code as it runs. The Logs tab shows new logs when you view and interact with the preview, showing how data was loaded, filtered, and transformed before rendering the output. For example, if you go to the preview tab and change multiple dropdowns that filter a chart, the logs update to show the new input values, the output of each filter step, and the final filtered data. Click on any step to expand it and preview the data at that point.
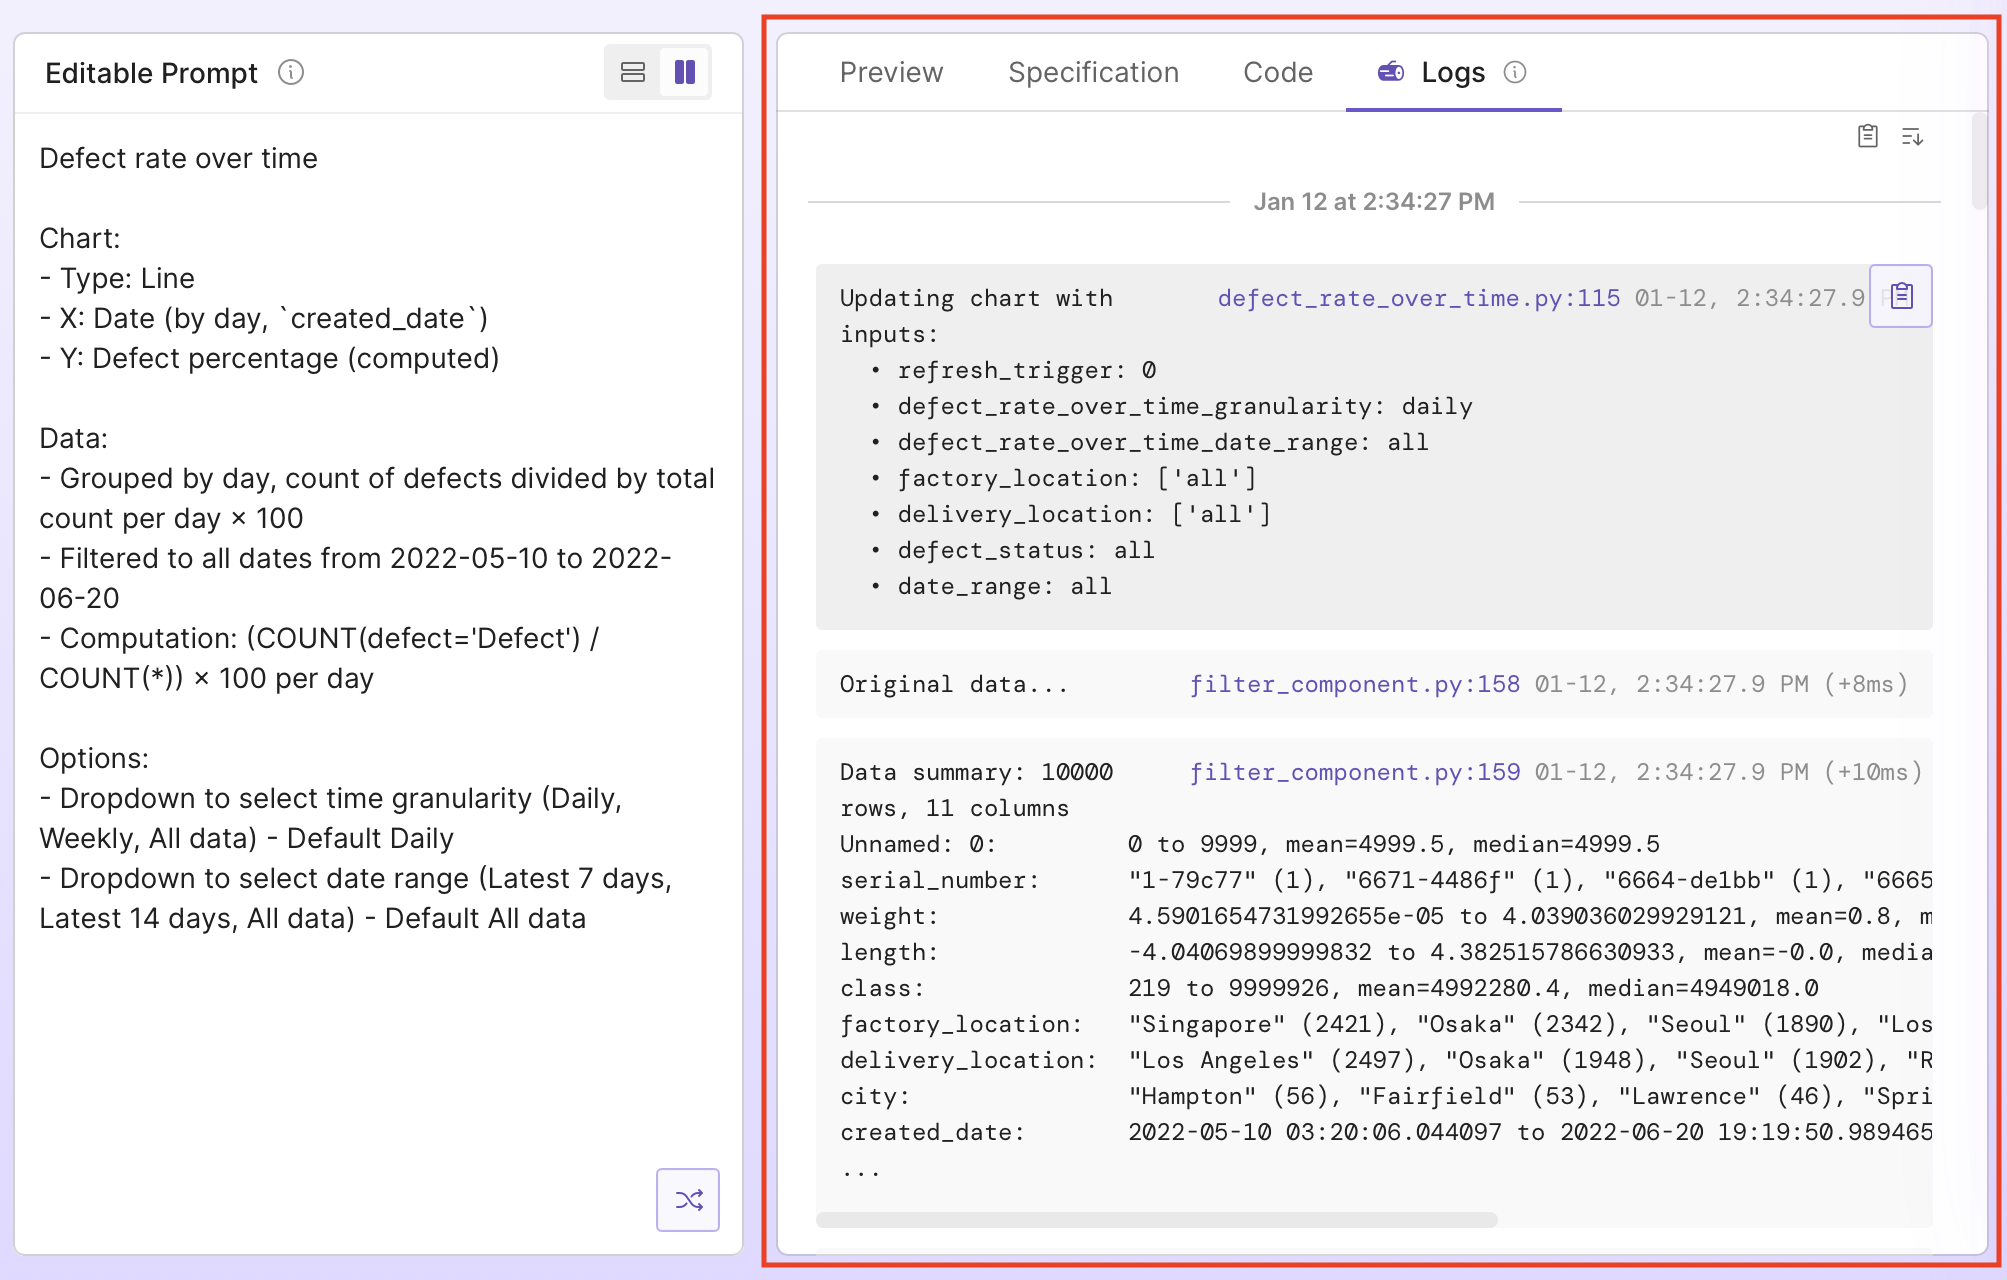
Logs are useful for understanding how the code works and how it filters data, as well as spot-checking data. If you edit your code from the Code tab, logs can also help with debugging:
- Error tracebacks: See the full error traceback with context from log messages before the error occurred.
- Performance: See timestamps on the right that show how long each step takes, helping you identify slow operations.
- Debug statements: See the output of any
logger.debug()statements in your code. Add them to your code or ask Plotly Studio to add them via the prompt to help with debugging specific parts of the component.
Exporting the app
You can export your app to edit and run it outside of Plotly Studio. See Exporting the Code for details.
Additional resources
- The code generated by Plotly Studio is a Dash app that uses Dash components and Plotly charts. If you are new to Dash and Plotly.py, the minimal Dash app example and Plotly Express page are good places to get started to understand the code.
- Dash AG Grid Documentation.
- Plotly.py Documentation
- Dash Documentation