Data Sources
Add data from files or external sources, then chat with Plotly Studio to query and transform it to build your app.
Note
The data source chat interface is available for projects created in Plotly Studio version 0.0.46 and later. As of version 0.0.52, you can migrate projects created using the legacy data module when you open them.
Adding data
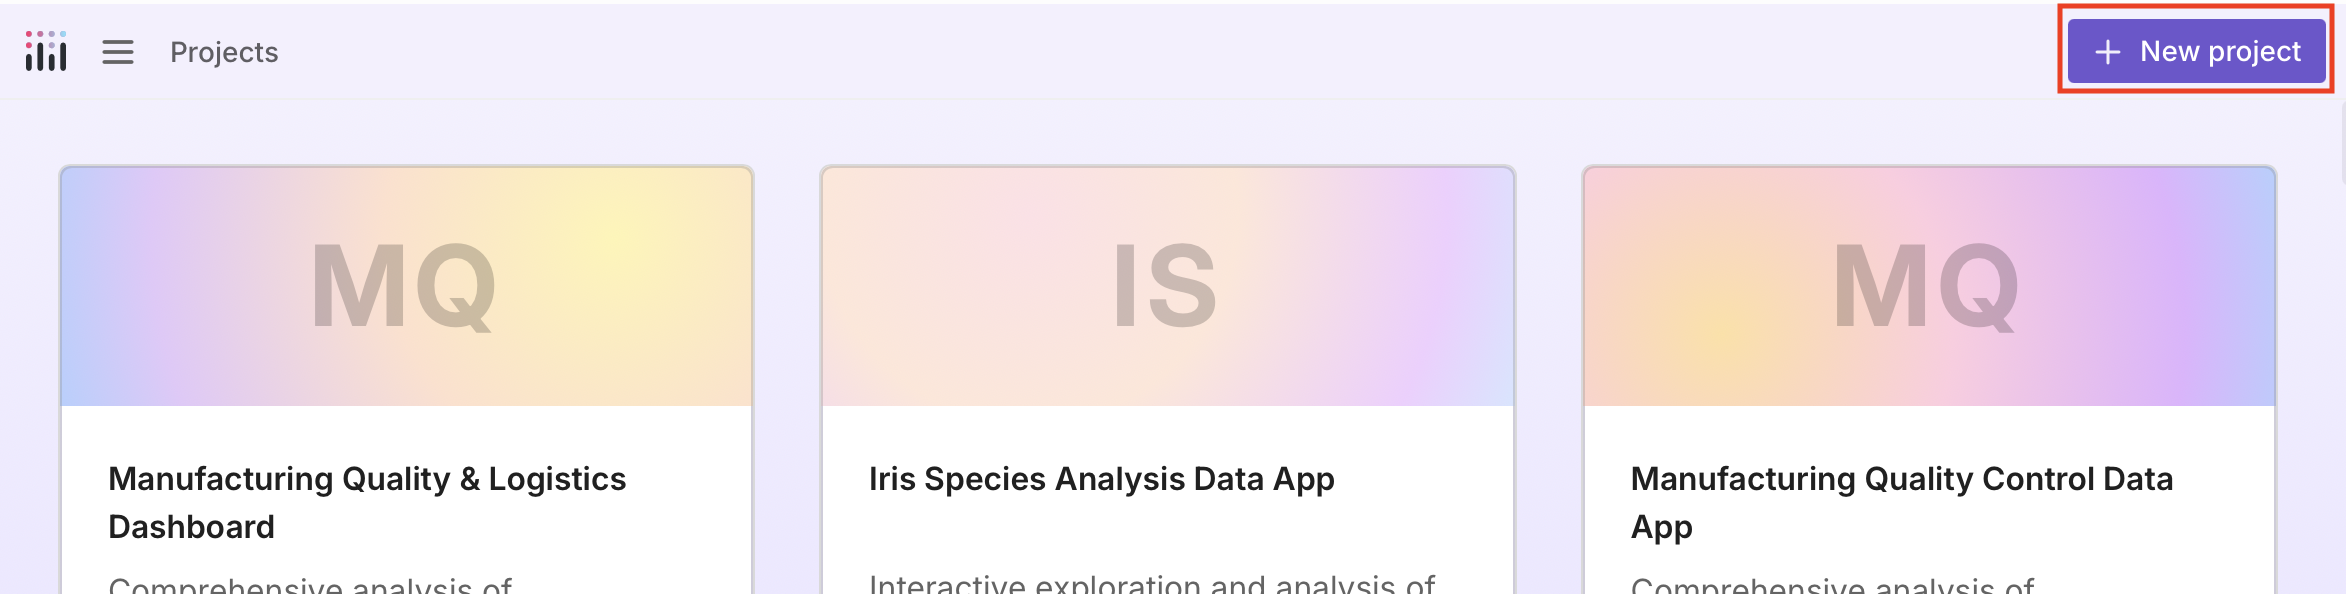
To get started, select + New project from the Projects page.
You can upload a file directly or use the chat to connect to an external data source.
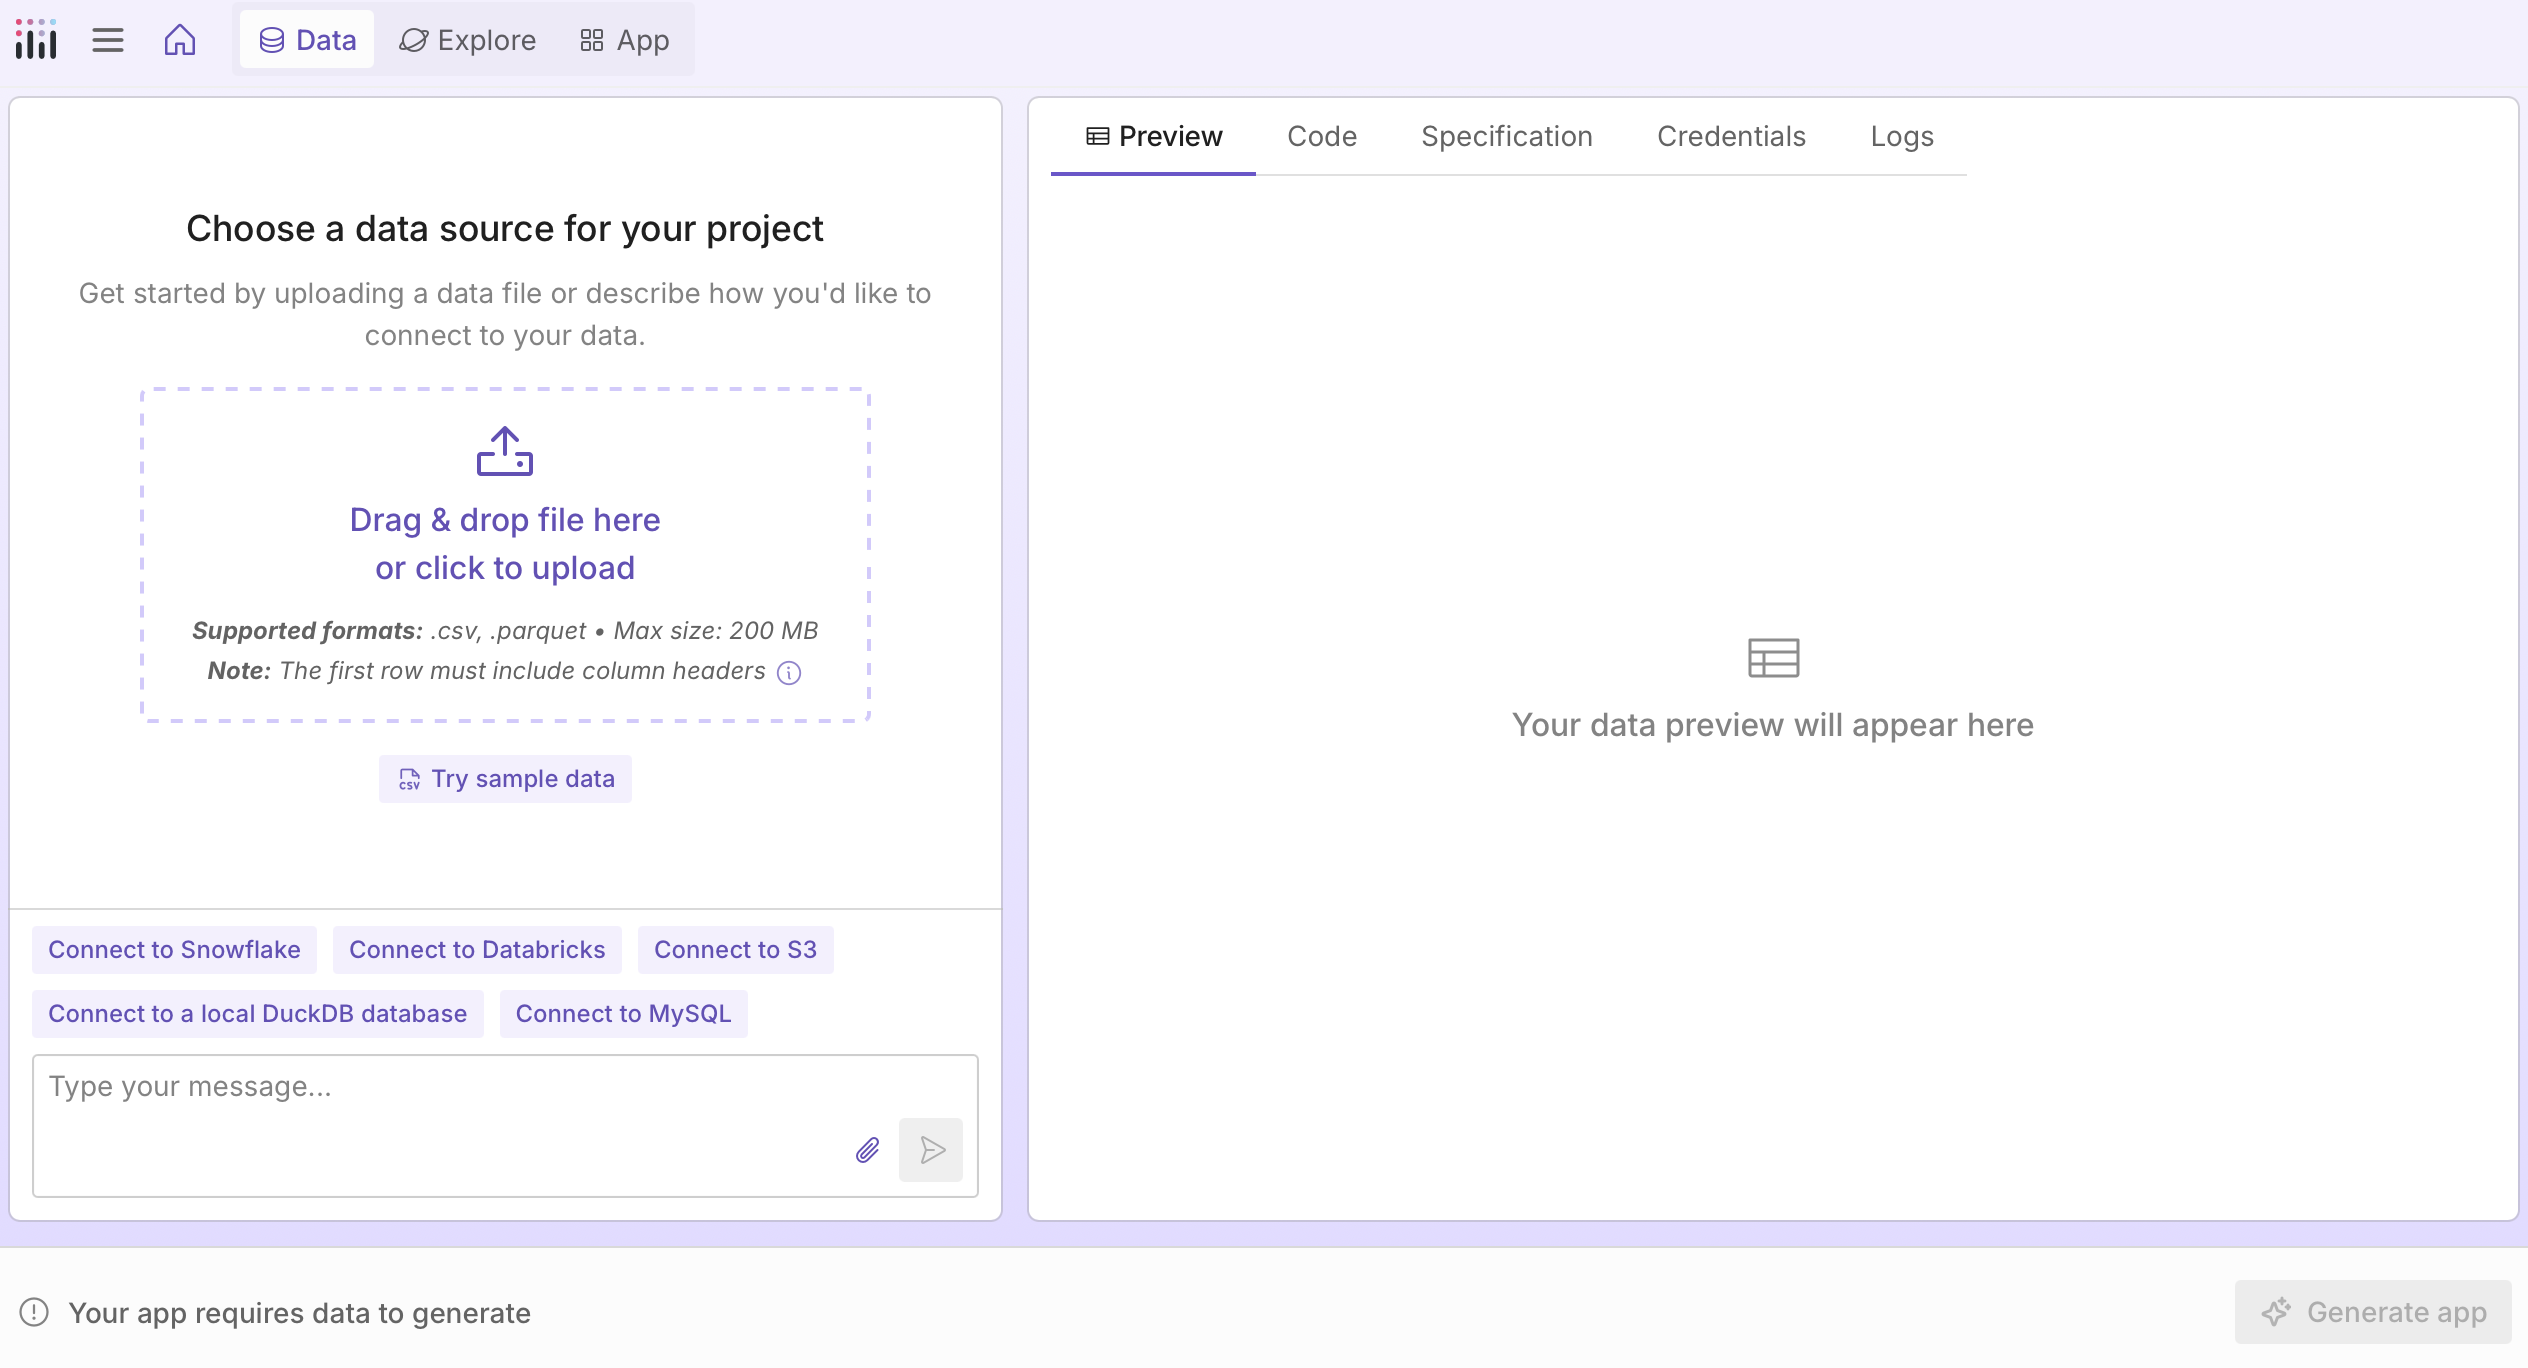
Uploading a file or using sample data
Drag and drop a file into the chat or select the attach icon to upload a file (up to 200 MB). For structured data files like .csv, .tsv, .xlsx, and others that it can parse, Plotly Studio displays a preview.
If you upload a file Plotly Studio can't parse as structured data (like .txt or .md), it will ask how you'd like to work with it, or you can tell it directly (for example, "Count the frequency of words in this file").
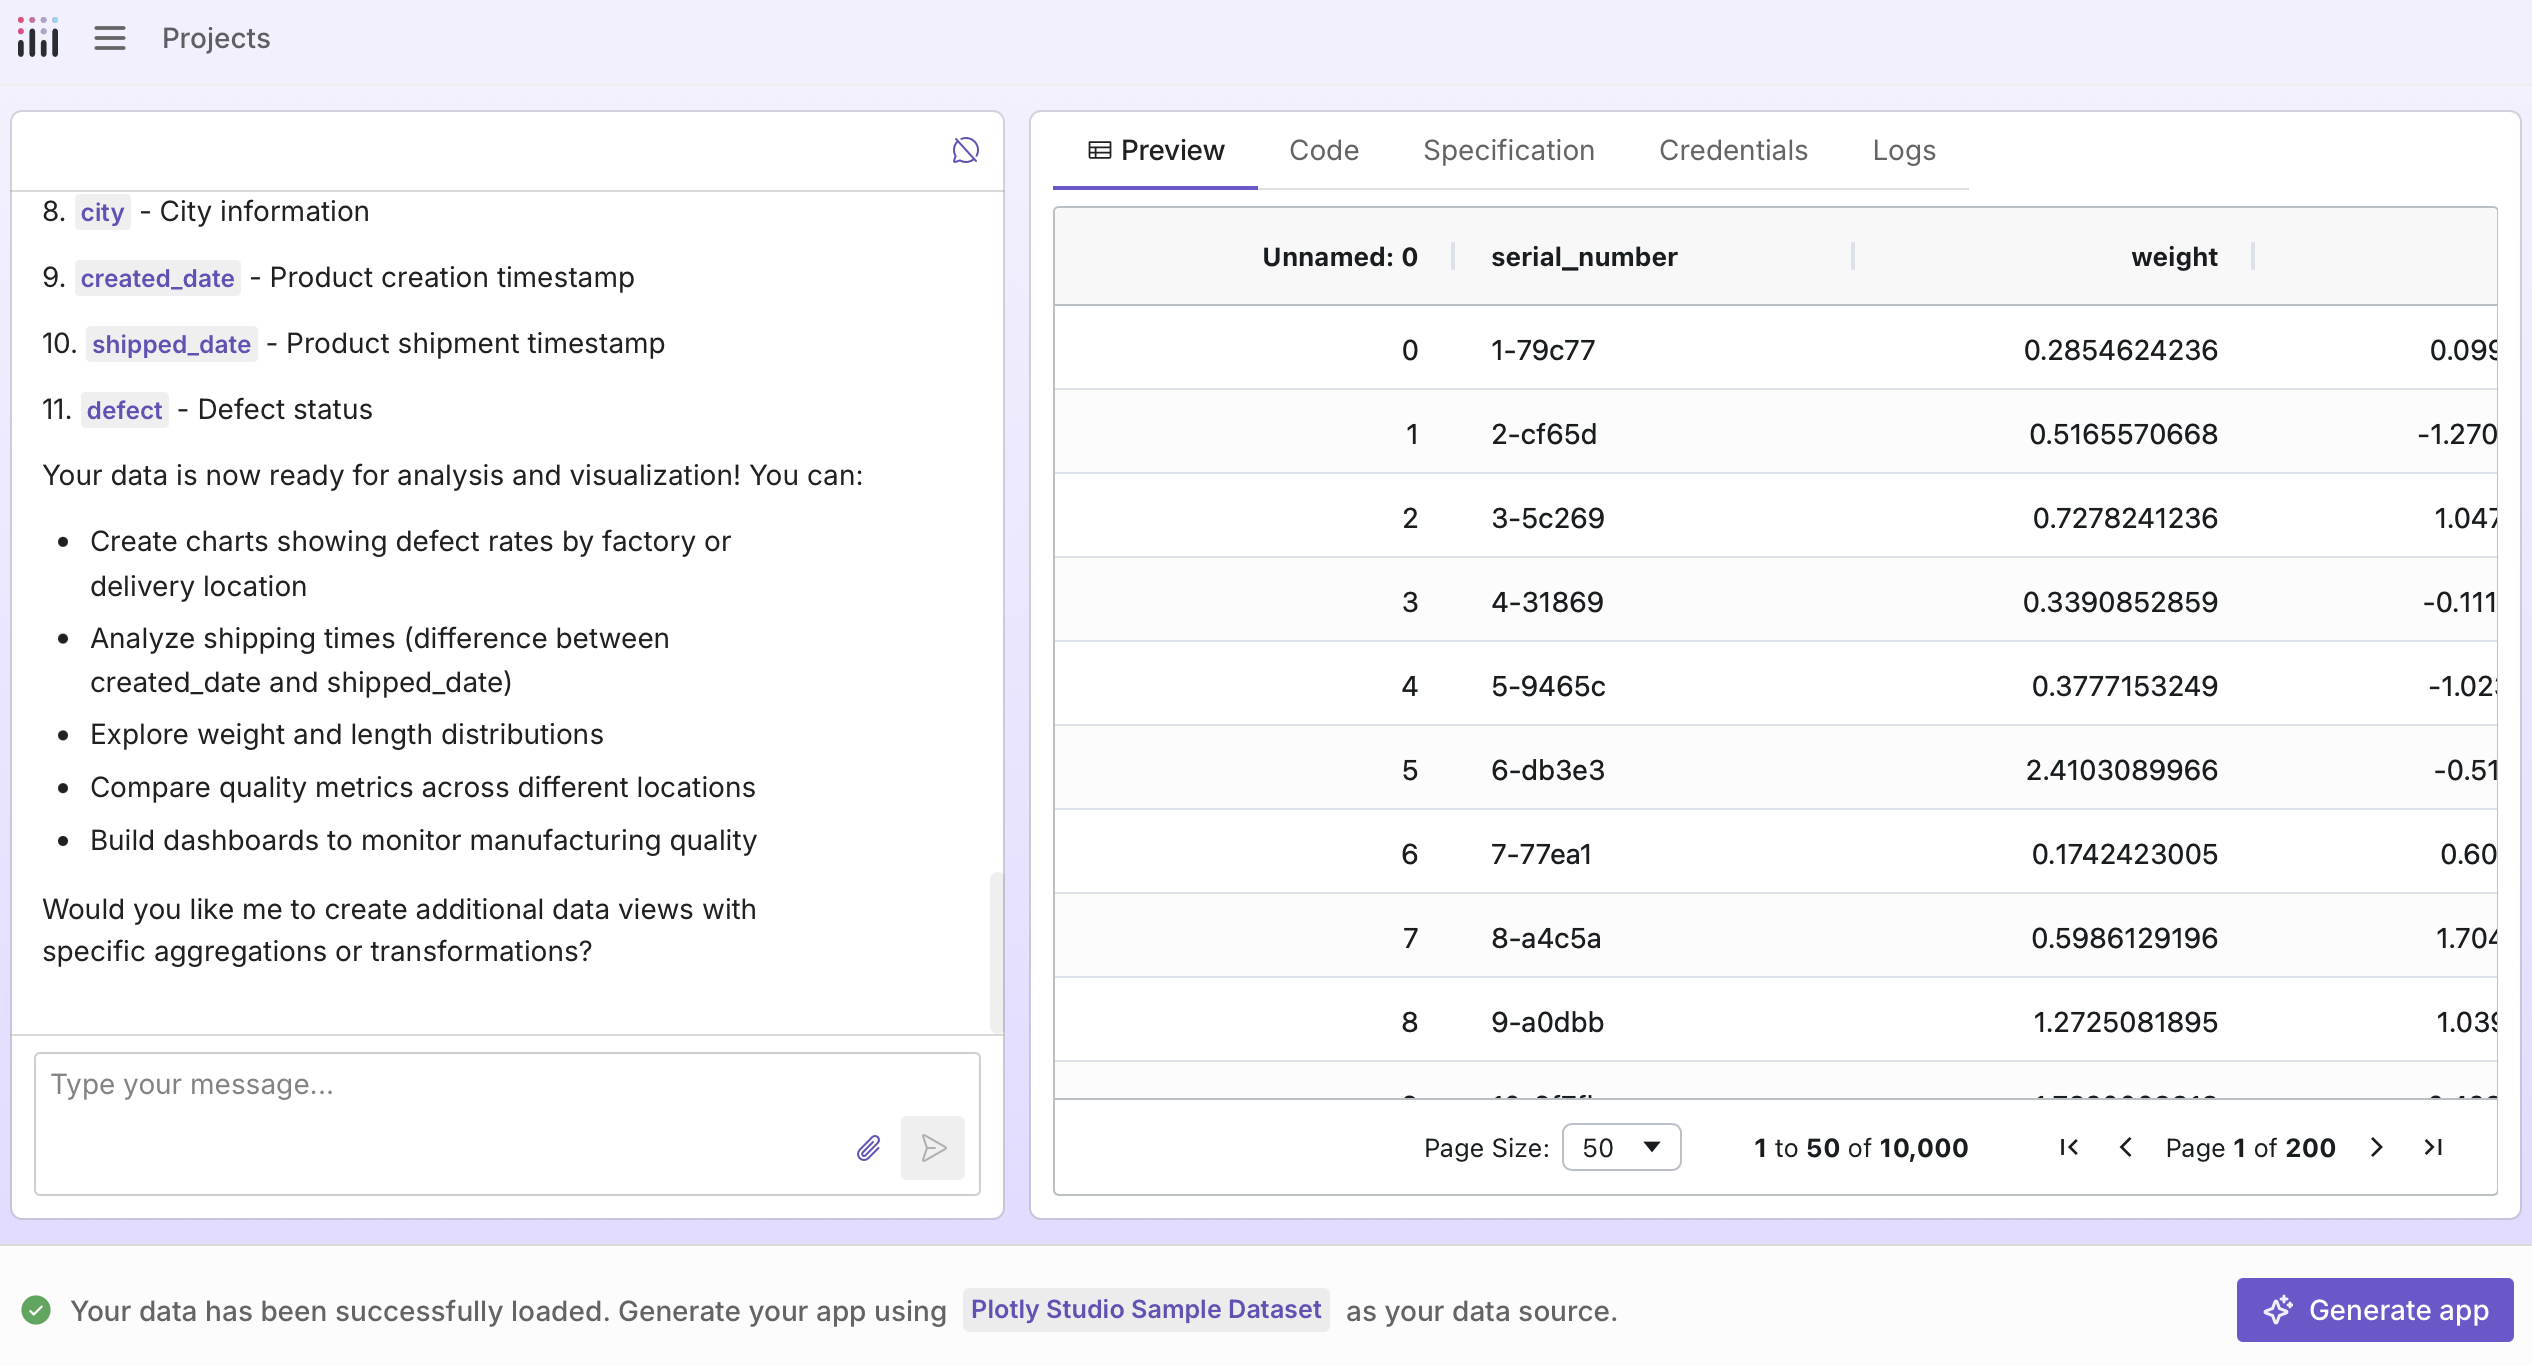
Once your data is loaded, you can query and transform it. See Querying and transforming data.
Tip
You can also ask the chat to generate sample data for your industry or use case (for example, "Create a sample dataset for a retail sales dashboard").
Connecting to external data sources
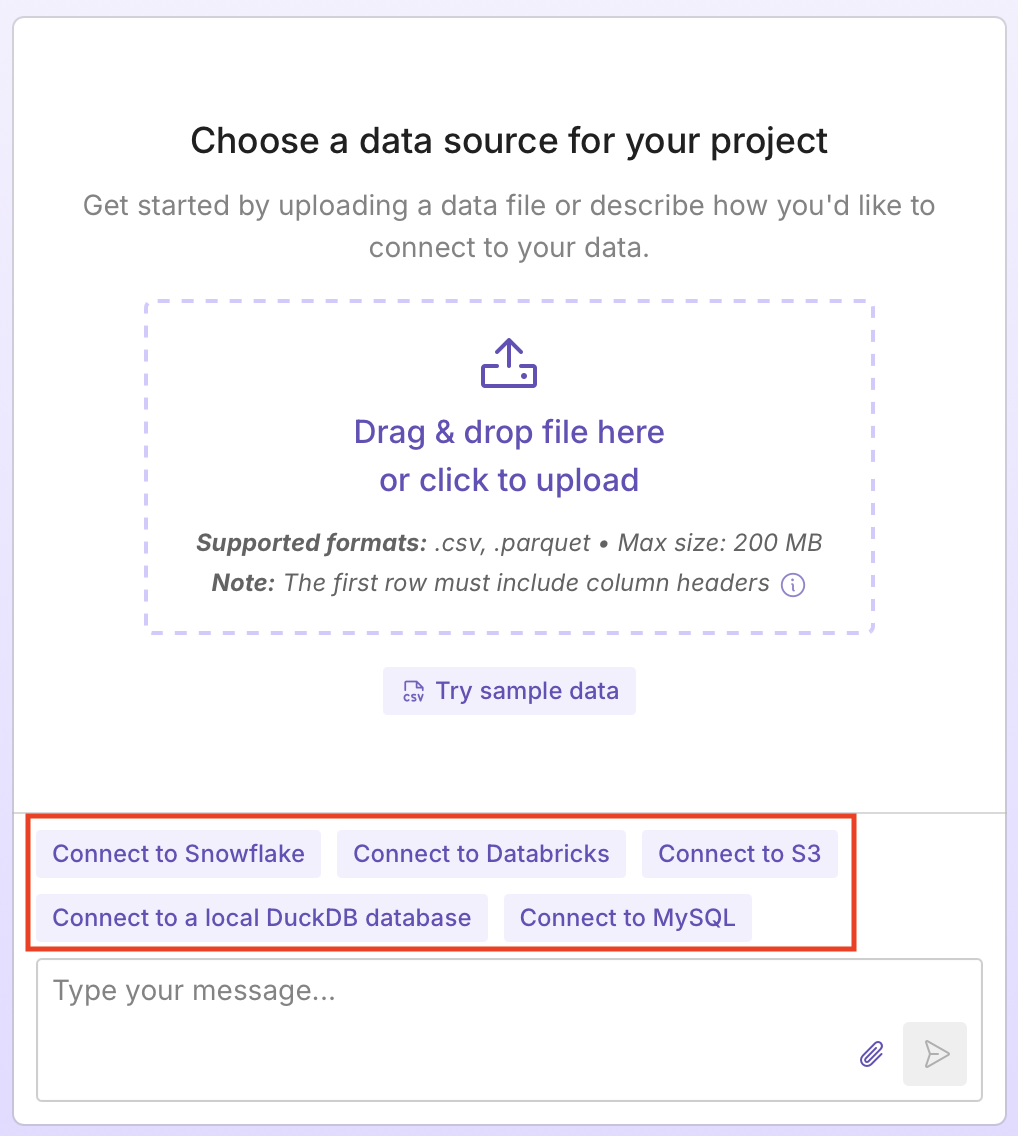
To connect to an external data source, for example, Snowflake, PostgreSQL, AWS S3, and more:
-
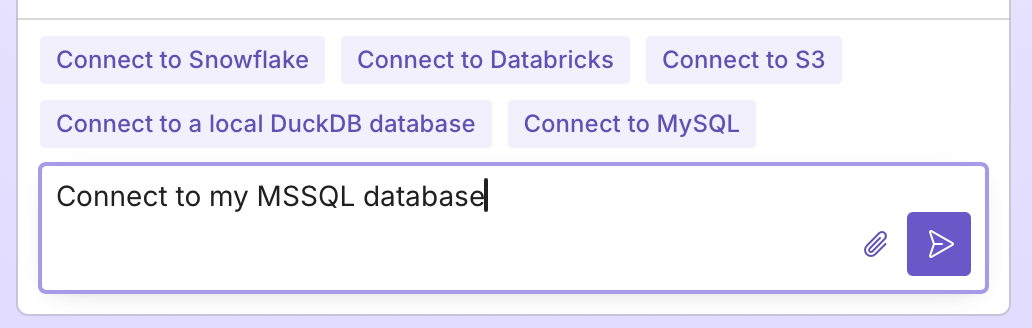
Request a connection in the chat by selecting one of the quick action buttons:
Or describe the data source you want to connect to. For example:
Connect to my PostgreSQL databaseConnect to my S3 bucketFetch data from the GitHub APISee Example data prompts for more examples.
Tip
If you need to start over, for example to change the data source, select Reset Conversation () in the top right corner of the chat.
-
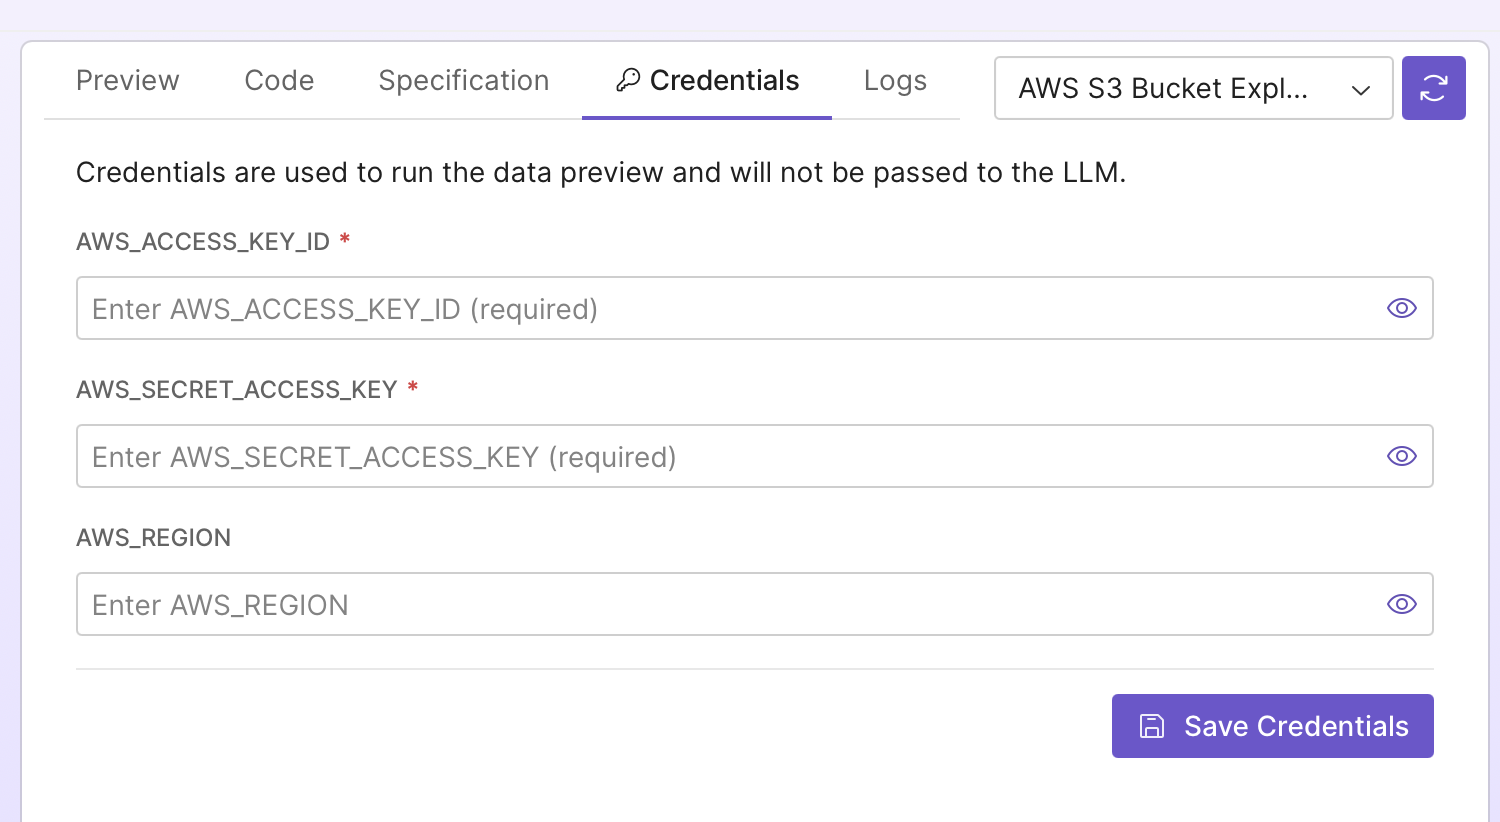
Select the Credentials tab, enter the required information for your data source, and select Save Credentials.
Note
When you add credentials, they are securely stored in your computer's keychain. When you publish your app, they are stored as secrets on Plotly Cloud or environment variables on Dash Enterprise, and used to connect to your data source when the app loads.
Tip
Some data sources support multiple authentication methods. If the credential fields don't match your setup, ask in the chat for a different method (e.g., "Connect using an API key" or "Connect using username and password").
-
After entering your credentials, Plotly Studio automatically switches to the Preview tab.
- If you requested a specific table or file, your data displays immediately.
-
If not, you'll see a list of available tables, schemas, or files. Use the chat to specify which one to load:
Load the orders table from my database
Once you have the dataset you want to work with, you can query and transform it. See Querying and transforming data.
Tip
View the Code tab to see the Python code, or the Specification tab for a plain-language description of how your data is loaded.
Using data from multiple sources
A Plotly Studio app loads data from a single table. You can add multiple files or external sources and tell Plotly Studio how to combine them.
Use the attach icon in the chat to upload additional files, or ask the chat to connect to another source. Then tell the chat how to work with your data. Files don't need to be of the same type. For example, if you upload a CSV with survey results and a JSON file with the survey schema, you could ask:
Merge the survey results with the schema
Example data prompts
Connecting to a database:
Connect to my PostgreSQL database
Loading a specific table from a database:
Connect to my MySQL database
Show me the customers table
Loading data from cloud storage:
Connect to my S3 bucket and load the sales data CSV
Fetching data from an API:
Get daily high and low temperatures for New York for the past 30 days from the Open-Meteo API
Loading data from a public Google Sheet:
Load data from this Google Sheet (no API key required): https://docs.google.com/spreadsheets/d/your-sheet-id
Loading a file from a URL:
Load the CSV file from this URL: https://raw.githubusercontent.com/plotly/datasets/master/gapminderDataFiveYear.csv
Combining files with identical schemas:
Combine the contents of both output_001.csv and output_002.csv into a single output. The schemas are identical between them.
Querying and transforming data
Once your data is loaded, you can query and transform it through natural language in the data sources chat. Some common tasks include filtering rows, creating calculated columns, cleaning data, and aggregating and grouping.
Here are some examples with the built-in dataset:
Filtering:
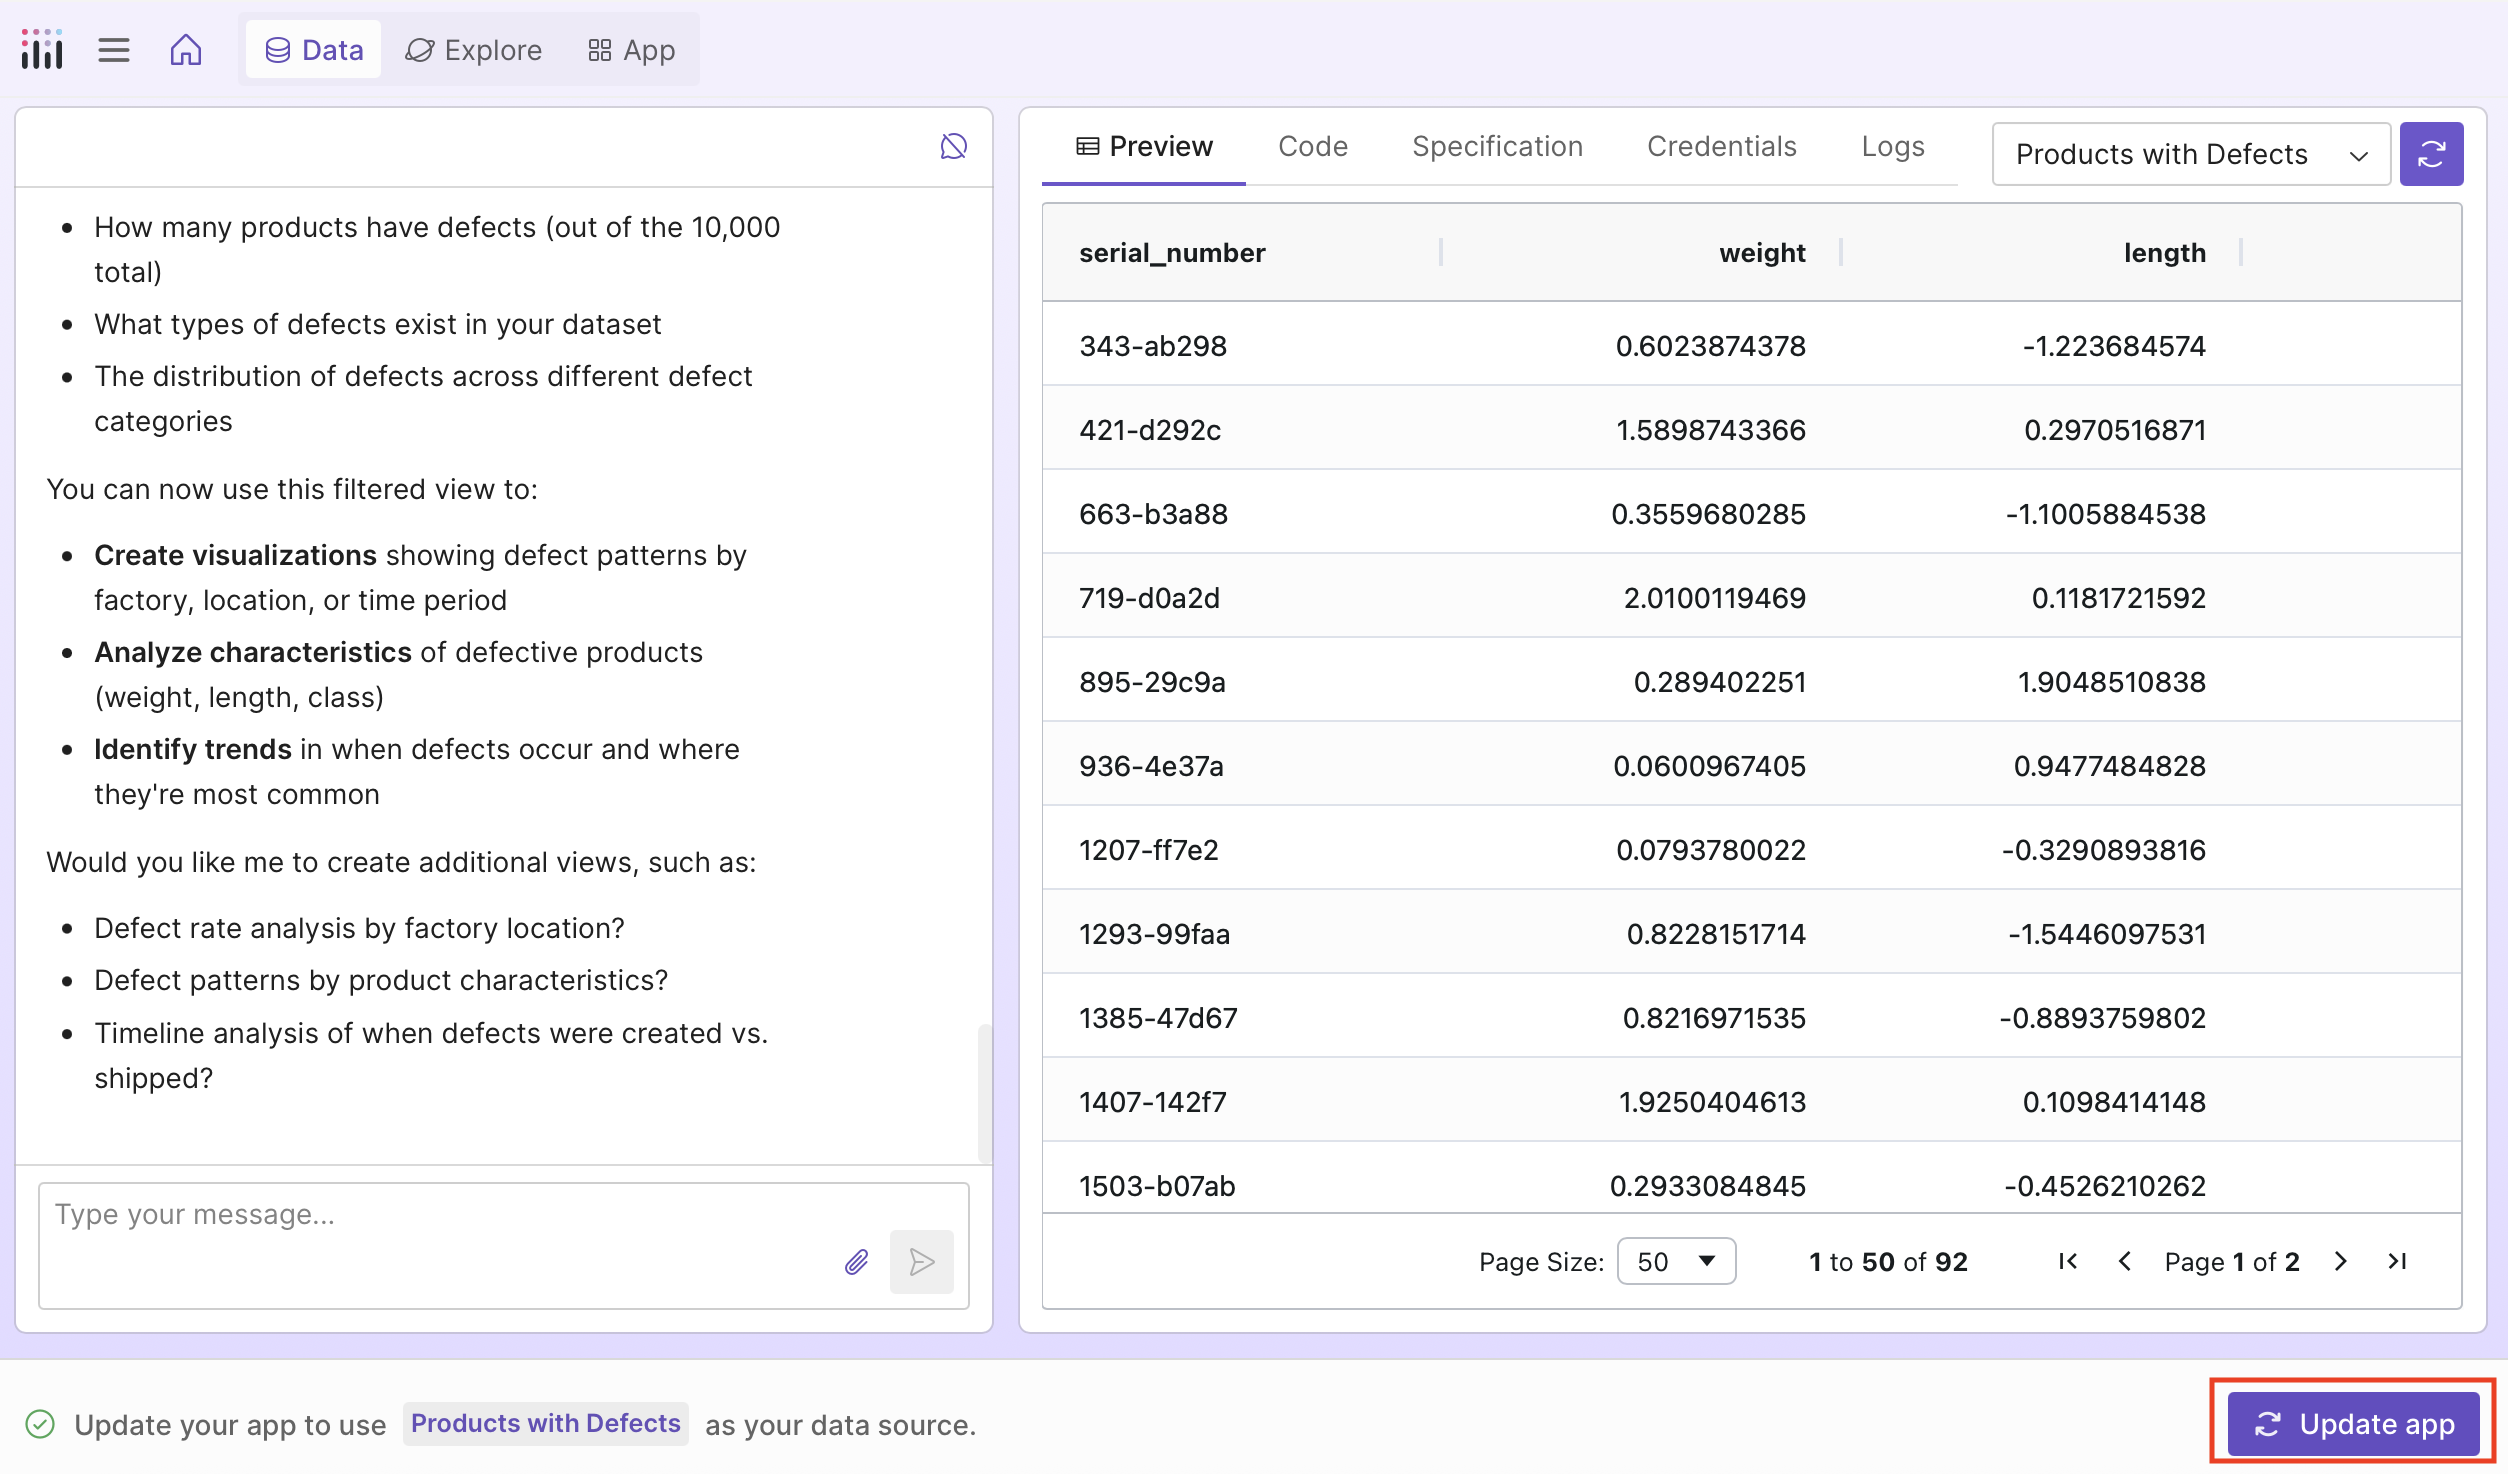
Show only shipments with defects
Filter to show only items from the Osaka factory
Show shipments created in June 2022
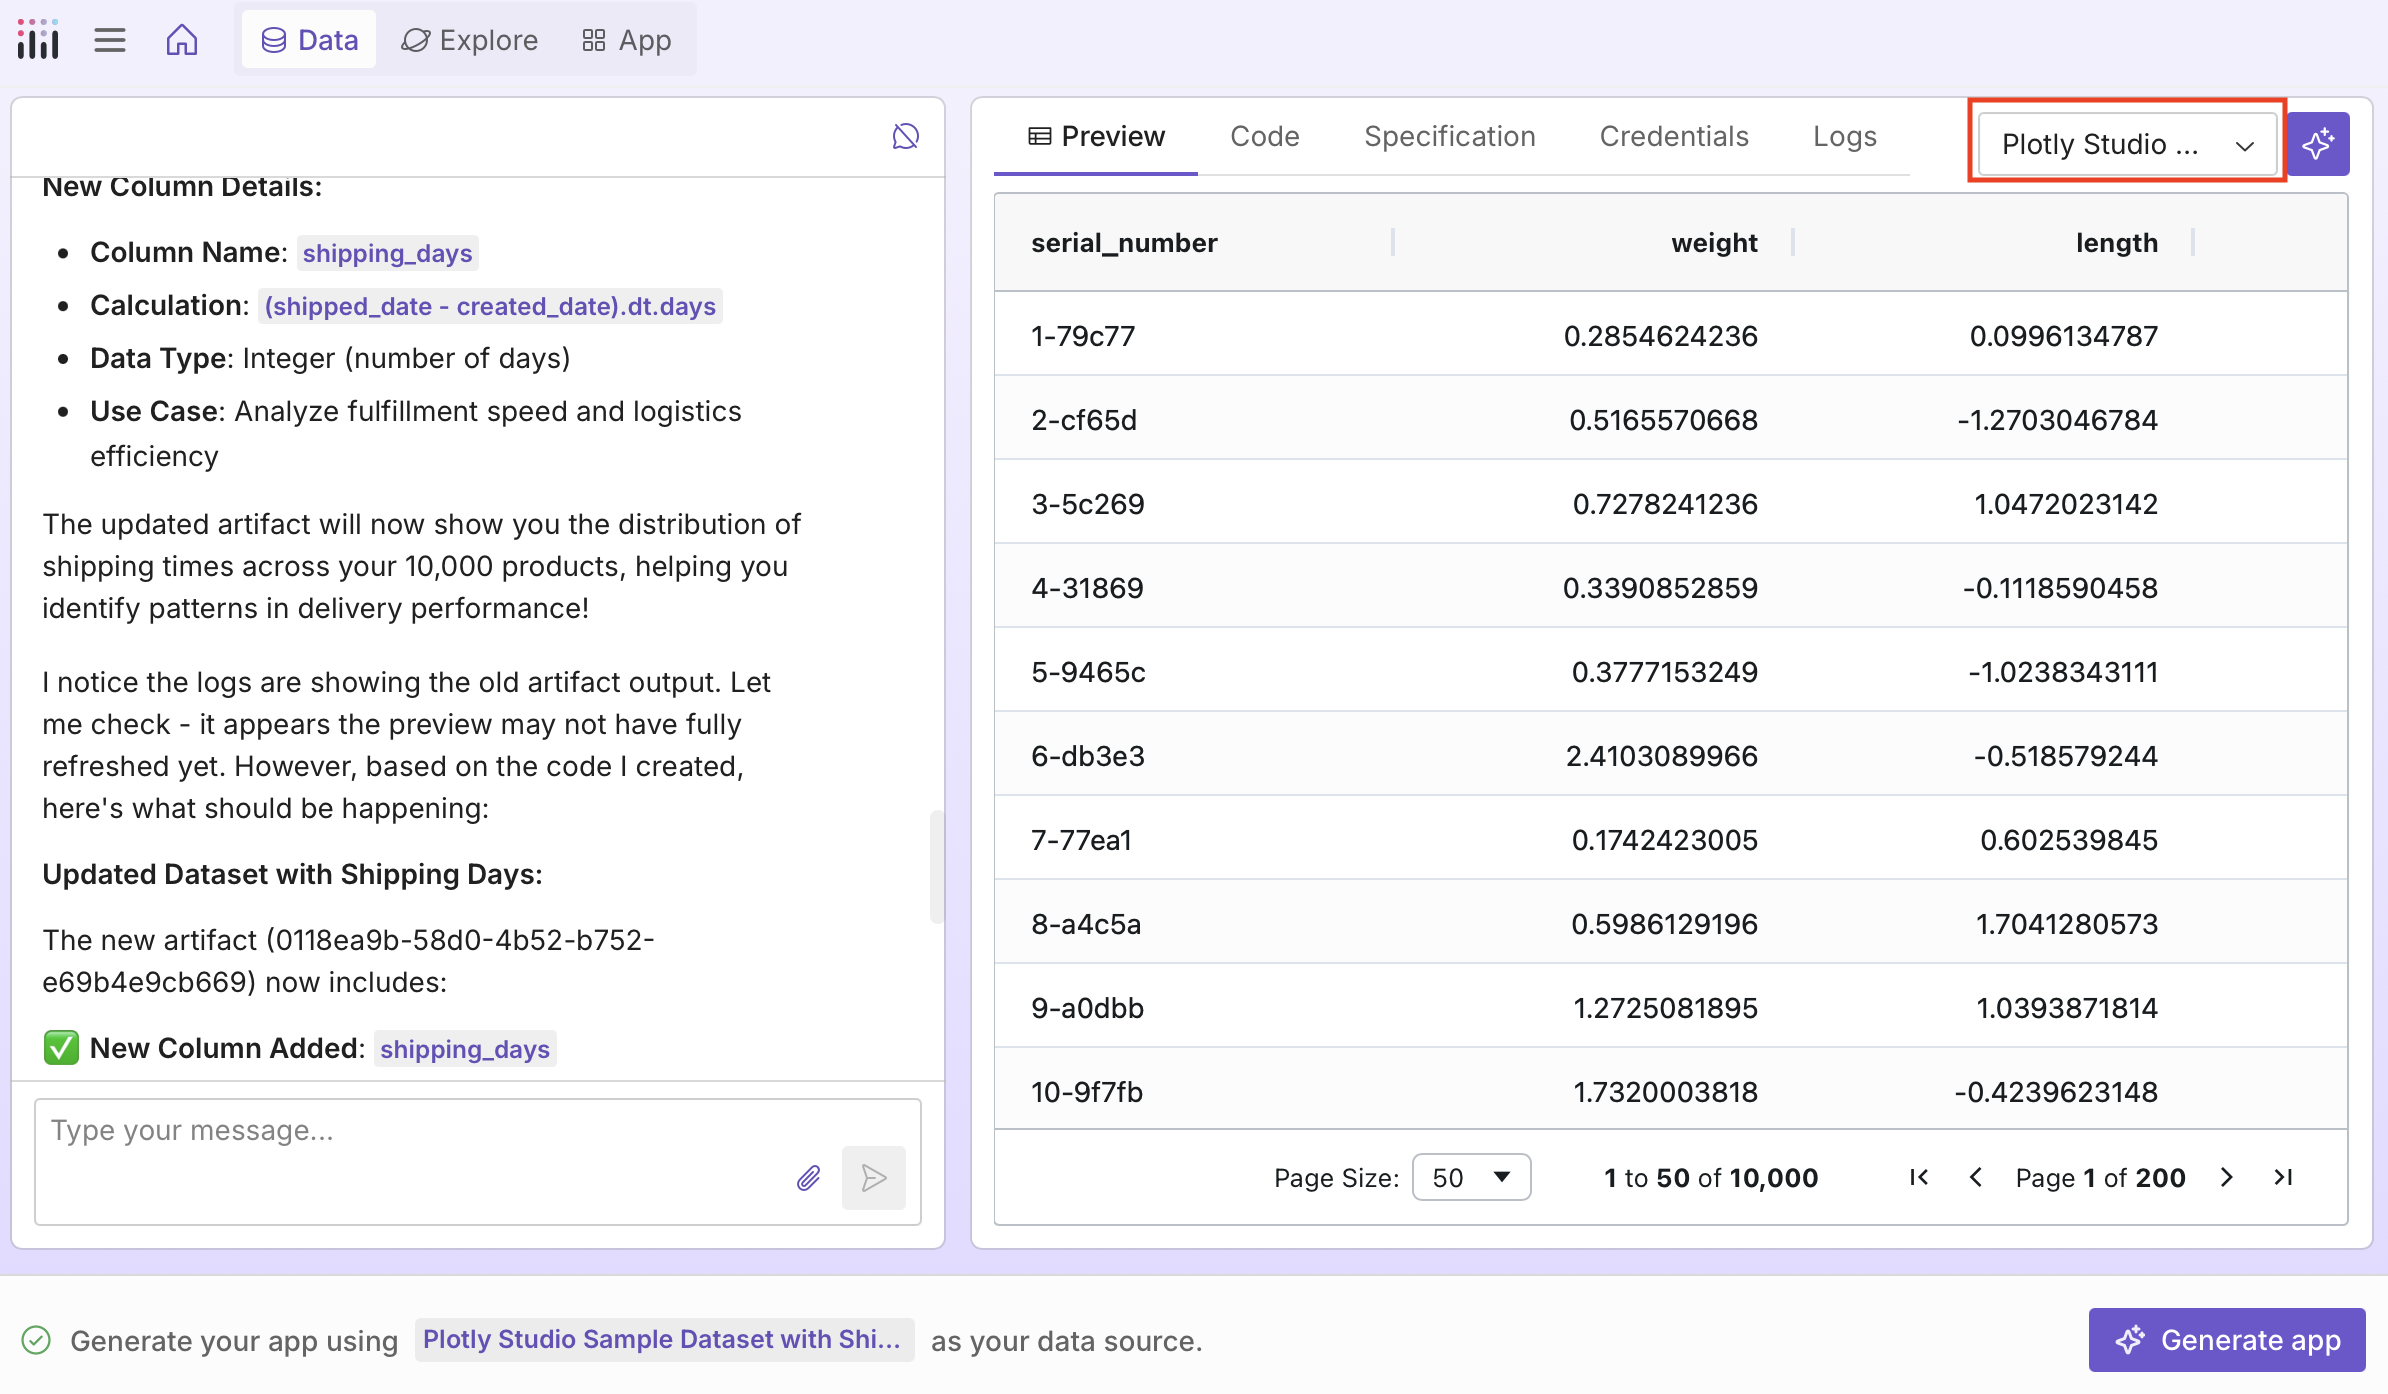
Creating calculated columns:
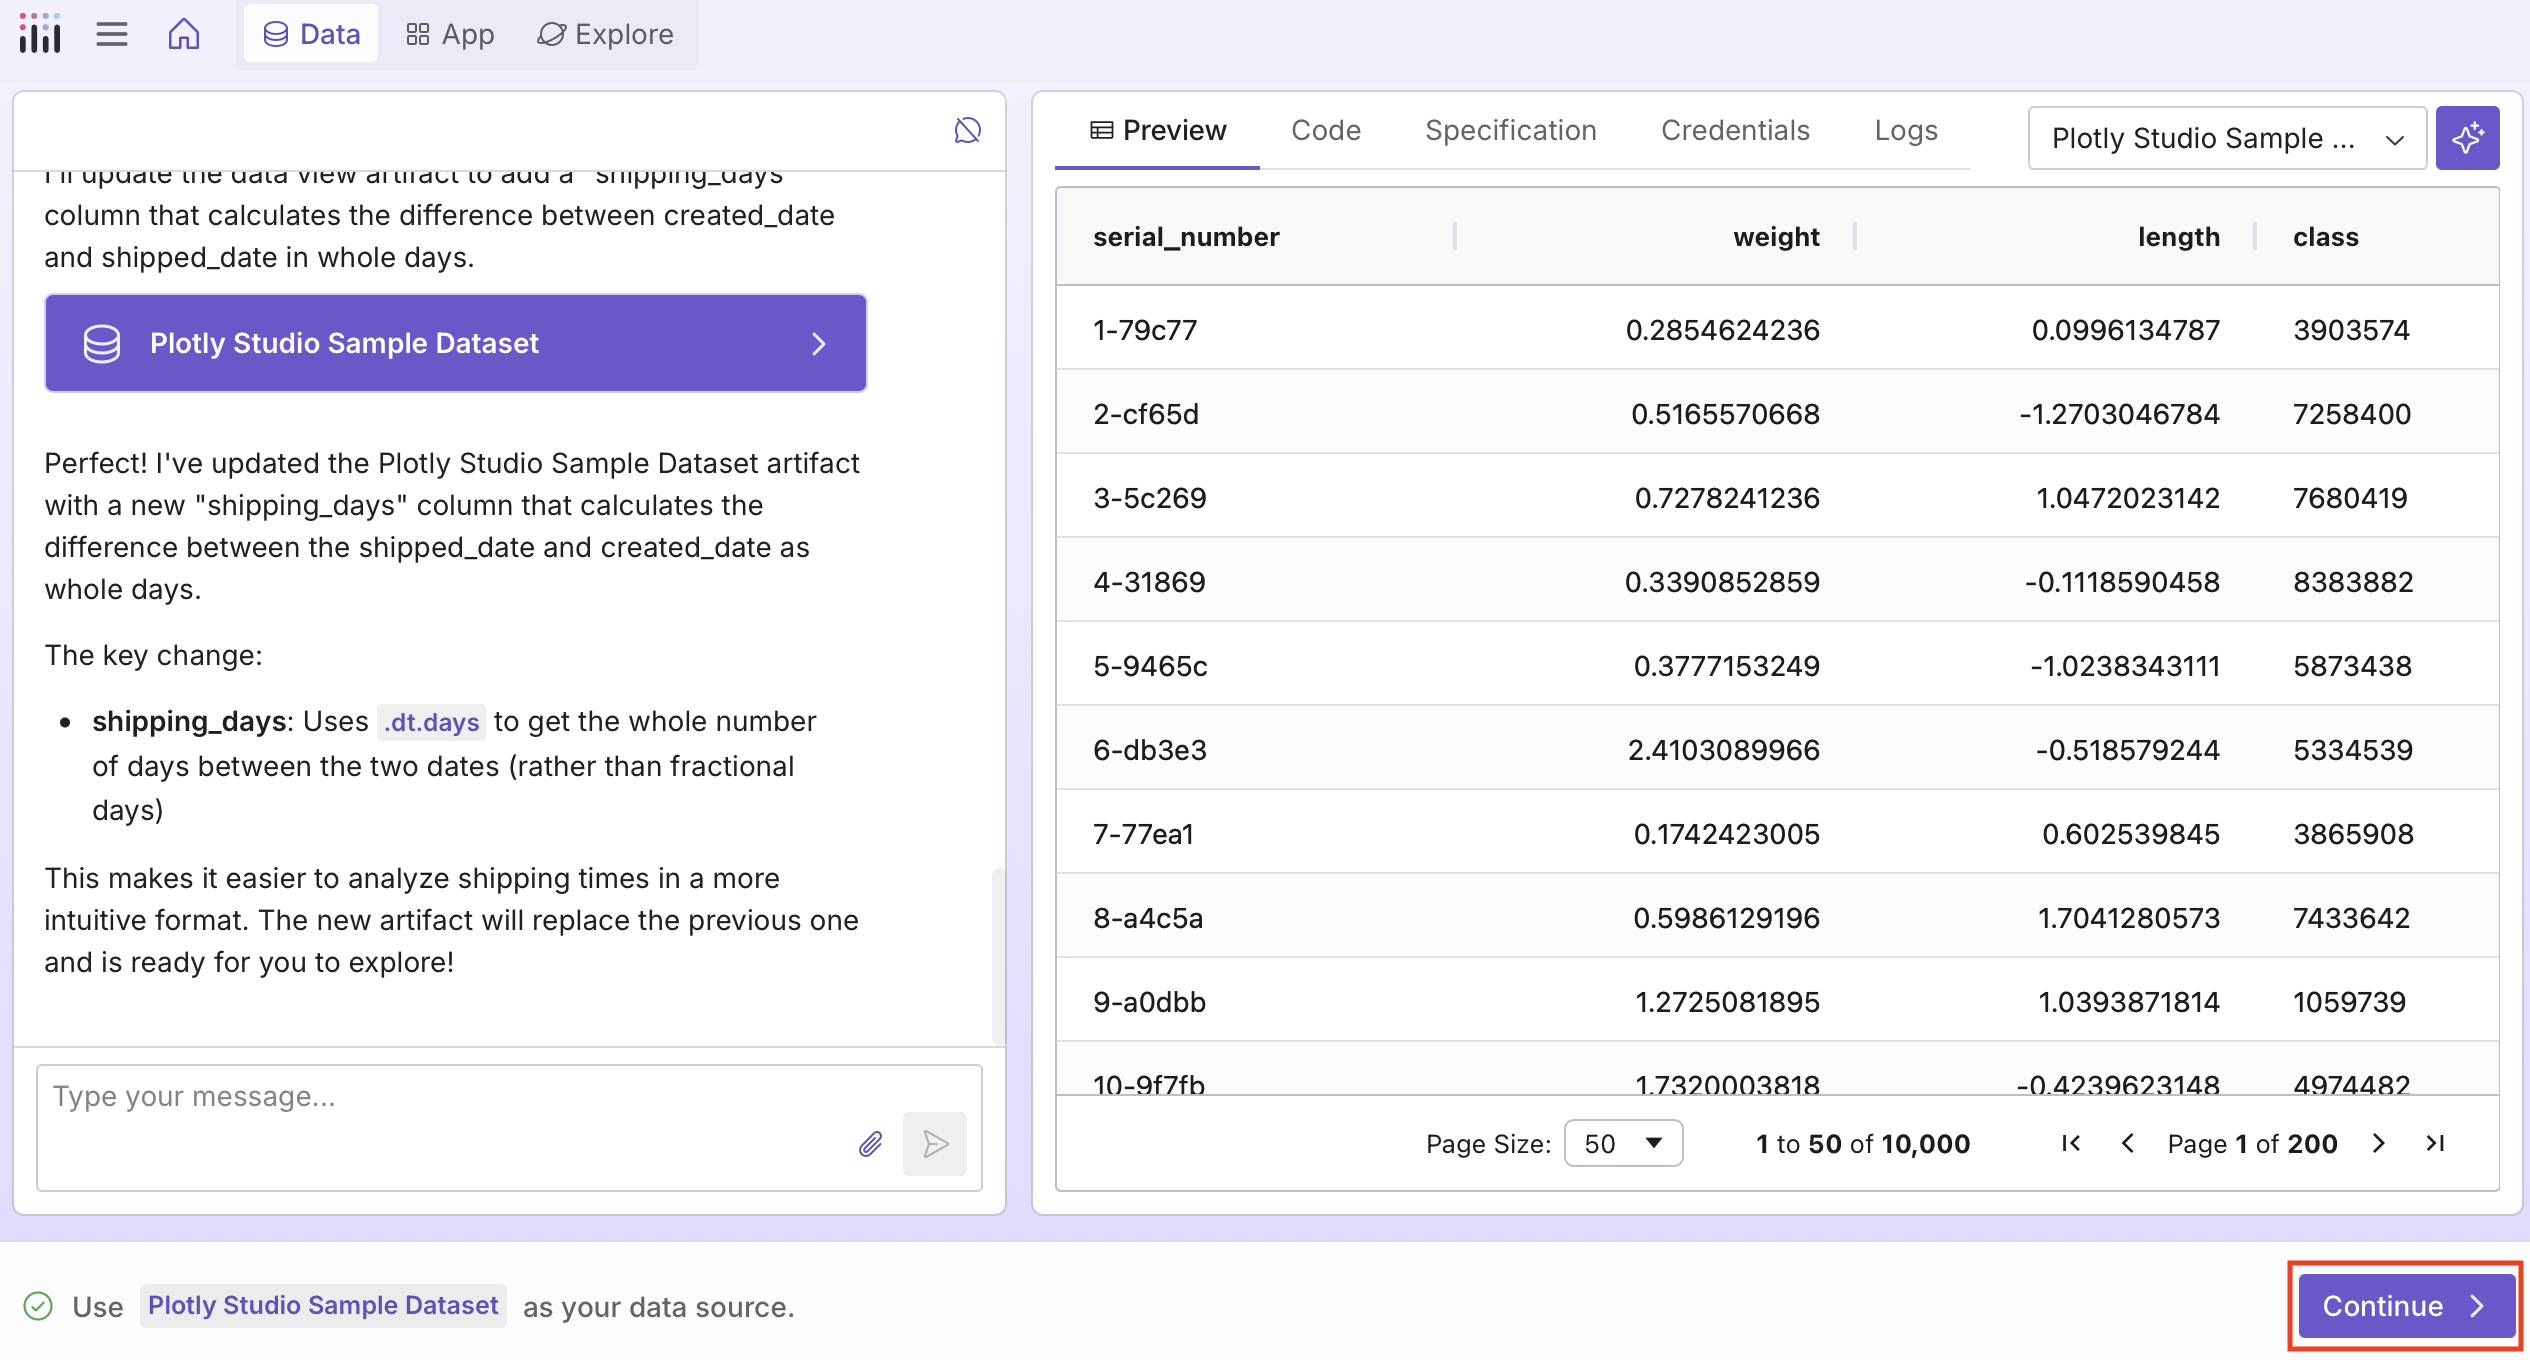
Add a column for shipping days (difference between shipped_date and created_date)
Create a column for weight category: light if weight < 0.5, medium if 0.5-1.5, heavy if > 1.5
Add a column called 'delayed' showing if shipping took more than 30 days
Cleaning data:
Remove rows with missing delivery locations
Fill missing weight values with the average
Aggregating and grouping:
Count the number of shipments by factory location
Calculate average shipping days by delivery location
Tip
You can also use SQL queries directly to select and transform your data. For example: SELECT * FROM table_name LIMIT 20
Scheduling automatic data refresh
By default, data does not refresh automatically. You can configure your data to refresh on a schedule by asking in the chat, for example:
Refresh my data every hour
Update the data daily at 6am
Refresh the data every 30 minutes
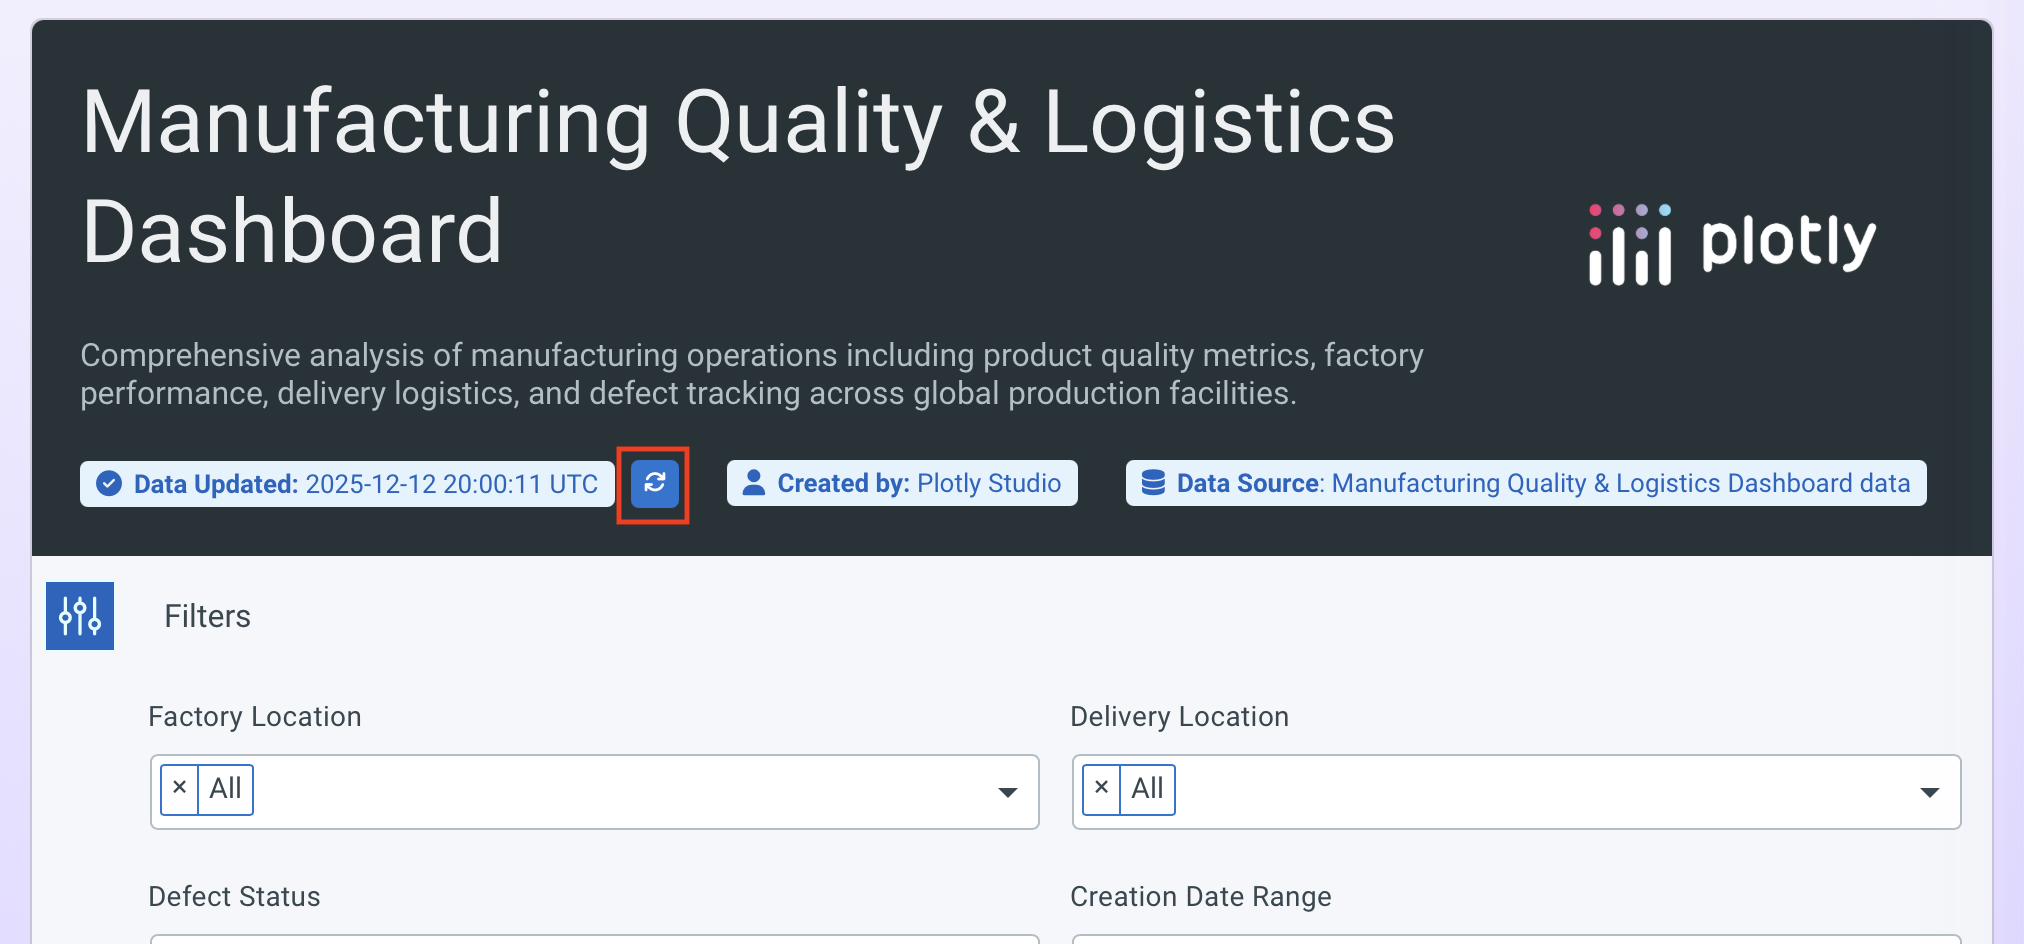
Once your app is generated, you can manually refresh your data at any time by selecting the refresh button next to the Data Updated timestamp. This is available in the app preview in Plotly Studio and, if published, in the published app.
Note
Data can be refreshed at most once per minute.
Generating your app from a data source
As you query and transform your data, Plotly Studio saves versions as separate data sources. Use the dropdown to switch between versions.
When you're happy with your data, select Continue to start building your app.
This takes you to the App tab where you can select Generate charts to generate a first draft with six charts and supporting components based on your data. Alternatively, you can Create a new visualization from scratch or explore suggestions.
Editing an existing data source
You can return to the Data tab at any time to modify your data source, queries, or transformations. You can also add new files using the attach icon or ask the chat to connect to new external data sources. Once you've made your changes, select Update to apply them.
Tip
The current and previously uploaded datasets are available in the dropdown in the upper right corner of the screen. The purple dot indicates which dataset is currently in use.
Troubleshooting
If you encounter connection issues, check the Logs tab for error messages. Common issues include:
- Incorrect credentials - Go back to the Credentials tab to update your username, password, or access keys.
- Network connectivity - Ensure your data source is accessible from your network.
- Permission errors - Confirm your credentials have the necessary permissions.
Tip
If you encounter an issue, try asking in the chat for help. You can provide the error logs from the Logs tab, or ask the chat for the next step to resolve the problem.
How your data is used
When Plotly Studio generates or updates your app, a data profile (not your full dataset) is sent to the large language model (LLM) so it can understand your data and generate code for charts. The data profile includes:
- The number of rows and columns
- Column names
- Up to 10 sample values per column
- For numeric and datetime columns: null count, range, mean, and median
- For string columns: null count, unique values, string length, alphabetical range, and most common values
Separately, Plotly may use datasets to improve the product. If you have a paid plan, go to Privacy Mode in User Settings to toggle this on/off. If you are on the Plotly Cloud Enterprise plan or use Studio with Dash Enterprise, we never collect your datasets. Privacy Mode does not affect the data profile sent to the LLM, which is required for app generation.