Getting Started
Follow this guide to learn how to create an app from a dataset in Plotly Studio. To get started, if you haven't already, download and install Plotly Studio.
Opening Plotly Studio and logging in
When you open Plotly Studio, select Login to get started or log in with Dash Enterprise. See the Installation page for more details on installing and logging into Plotly Studio for the first time.
Projects
In Plotly Studio, a project holds your app's data, the prompts used to generate the app, and generated code. All projects belong to a team.
Projects are automatically saved as you work, so you can leave a project and return to it later. Draft projects (projects that don't have an app generated yet) appear in your projects list alongside completed apps.
Creating a new project
When you log in for the first time, Plotly Studio opens on the New Project page where you can start creating your app. This takes you to the Data tab where you can add and transform your data.
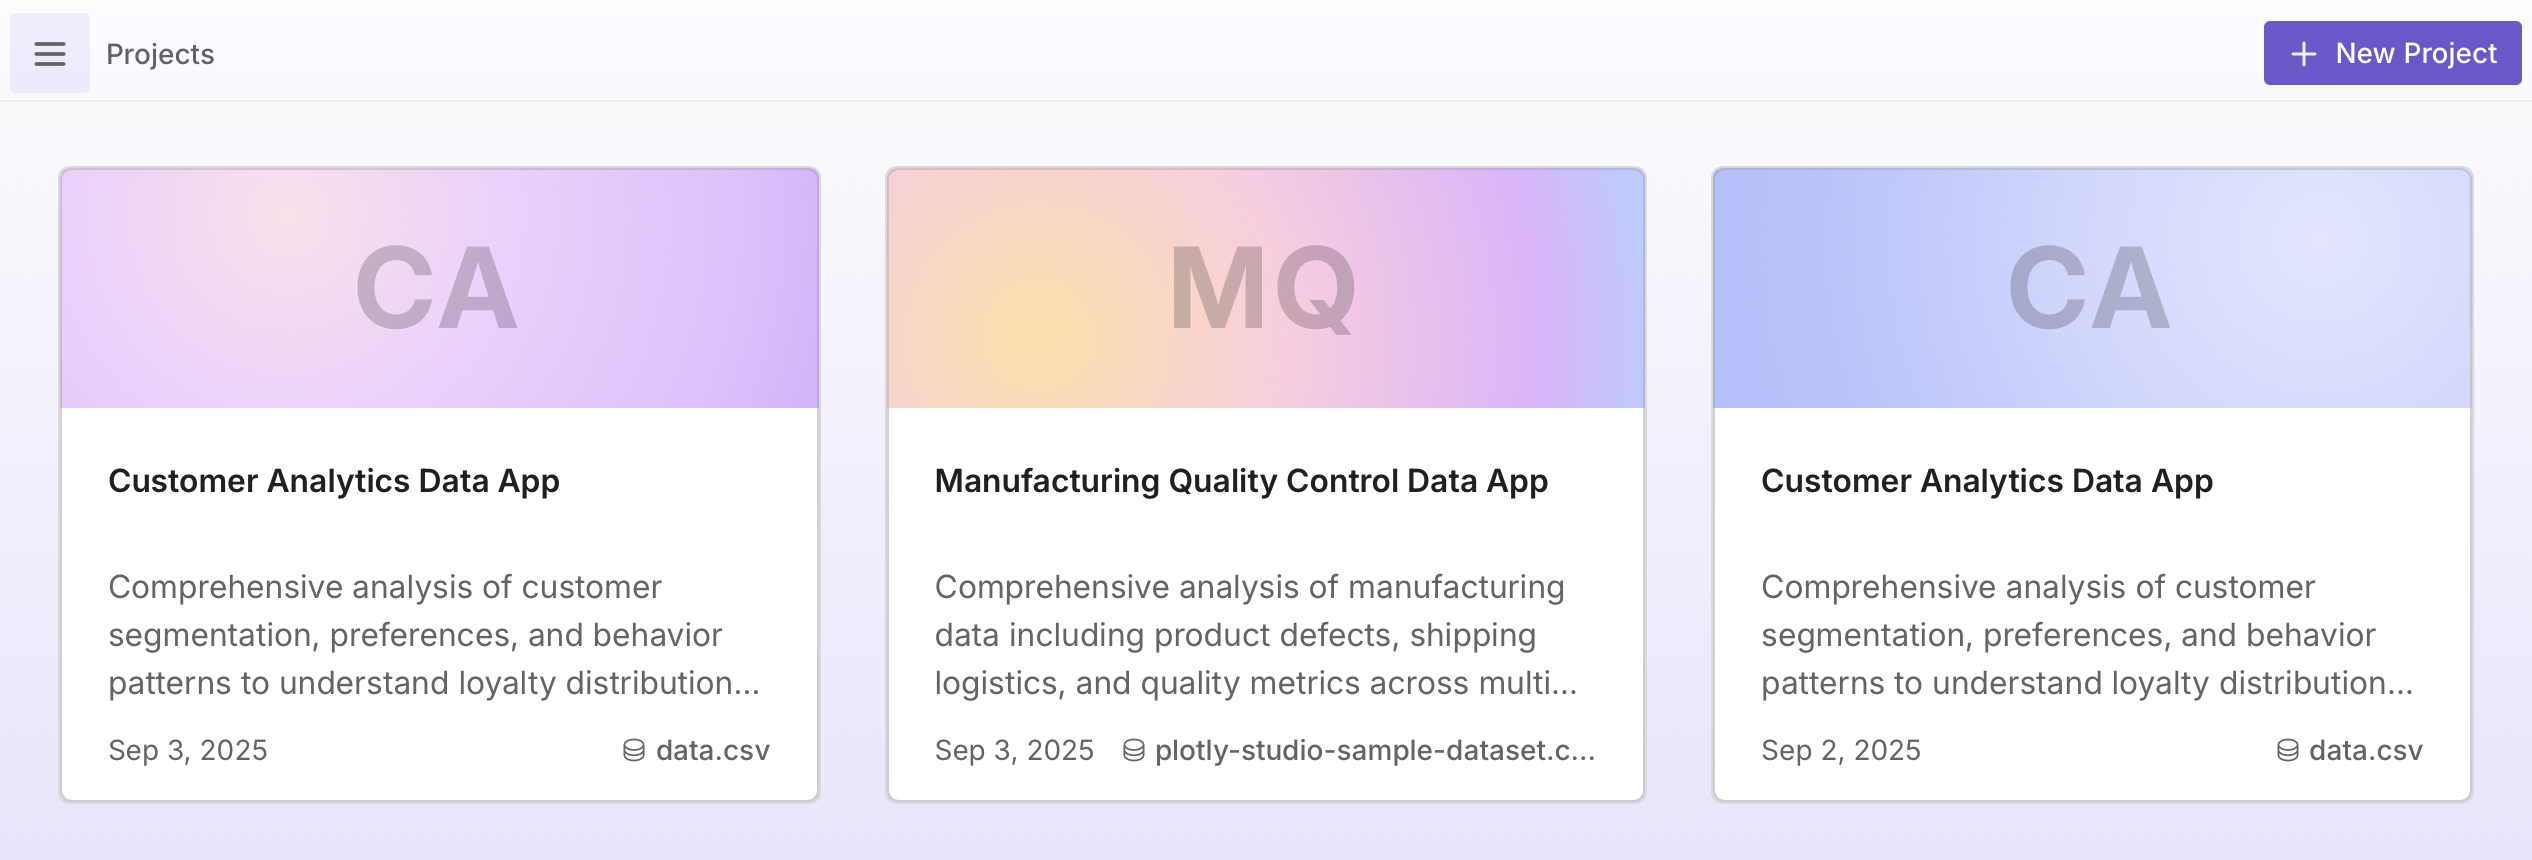
The next time you open Plotly Studio you'll be taken to the Projects page, where you can select + New Project to start a new project.
Managing projects
Select on a project card to edit project details (title, description, and tags), duplicate, or delete a project. See Projects for more details on managing your projects.
Navigating within a project
When working on a project, three tabs are always accessible at the top of Plotly Studio:
- Data - Upload files, connect to external data sources, and query and transform your data.
- App - Preview, edit, and publish your generated app.
- Explore - Browse suggested charts based on your data and create charts from images.
You can switch between these tabs as you build your app. For example, you can go back to Data to change the data source, go to App to see previews, edit existing charts, and publish or export the app, or go to Explore to see chart suggestions.
Data
From the Data tab, you can add data, query and transform it, and select which version of the data to use for your app.
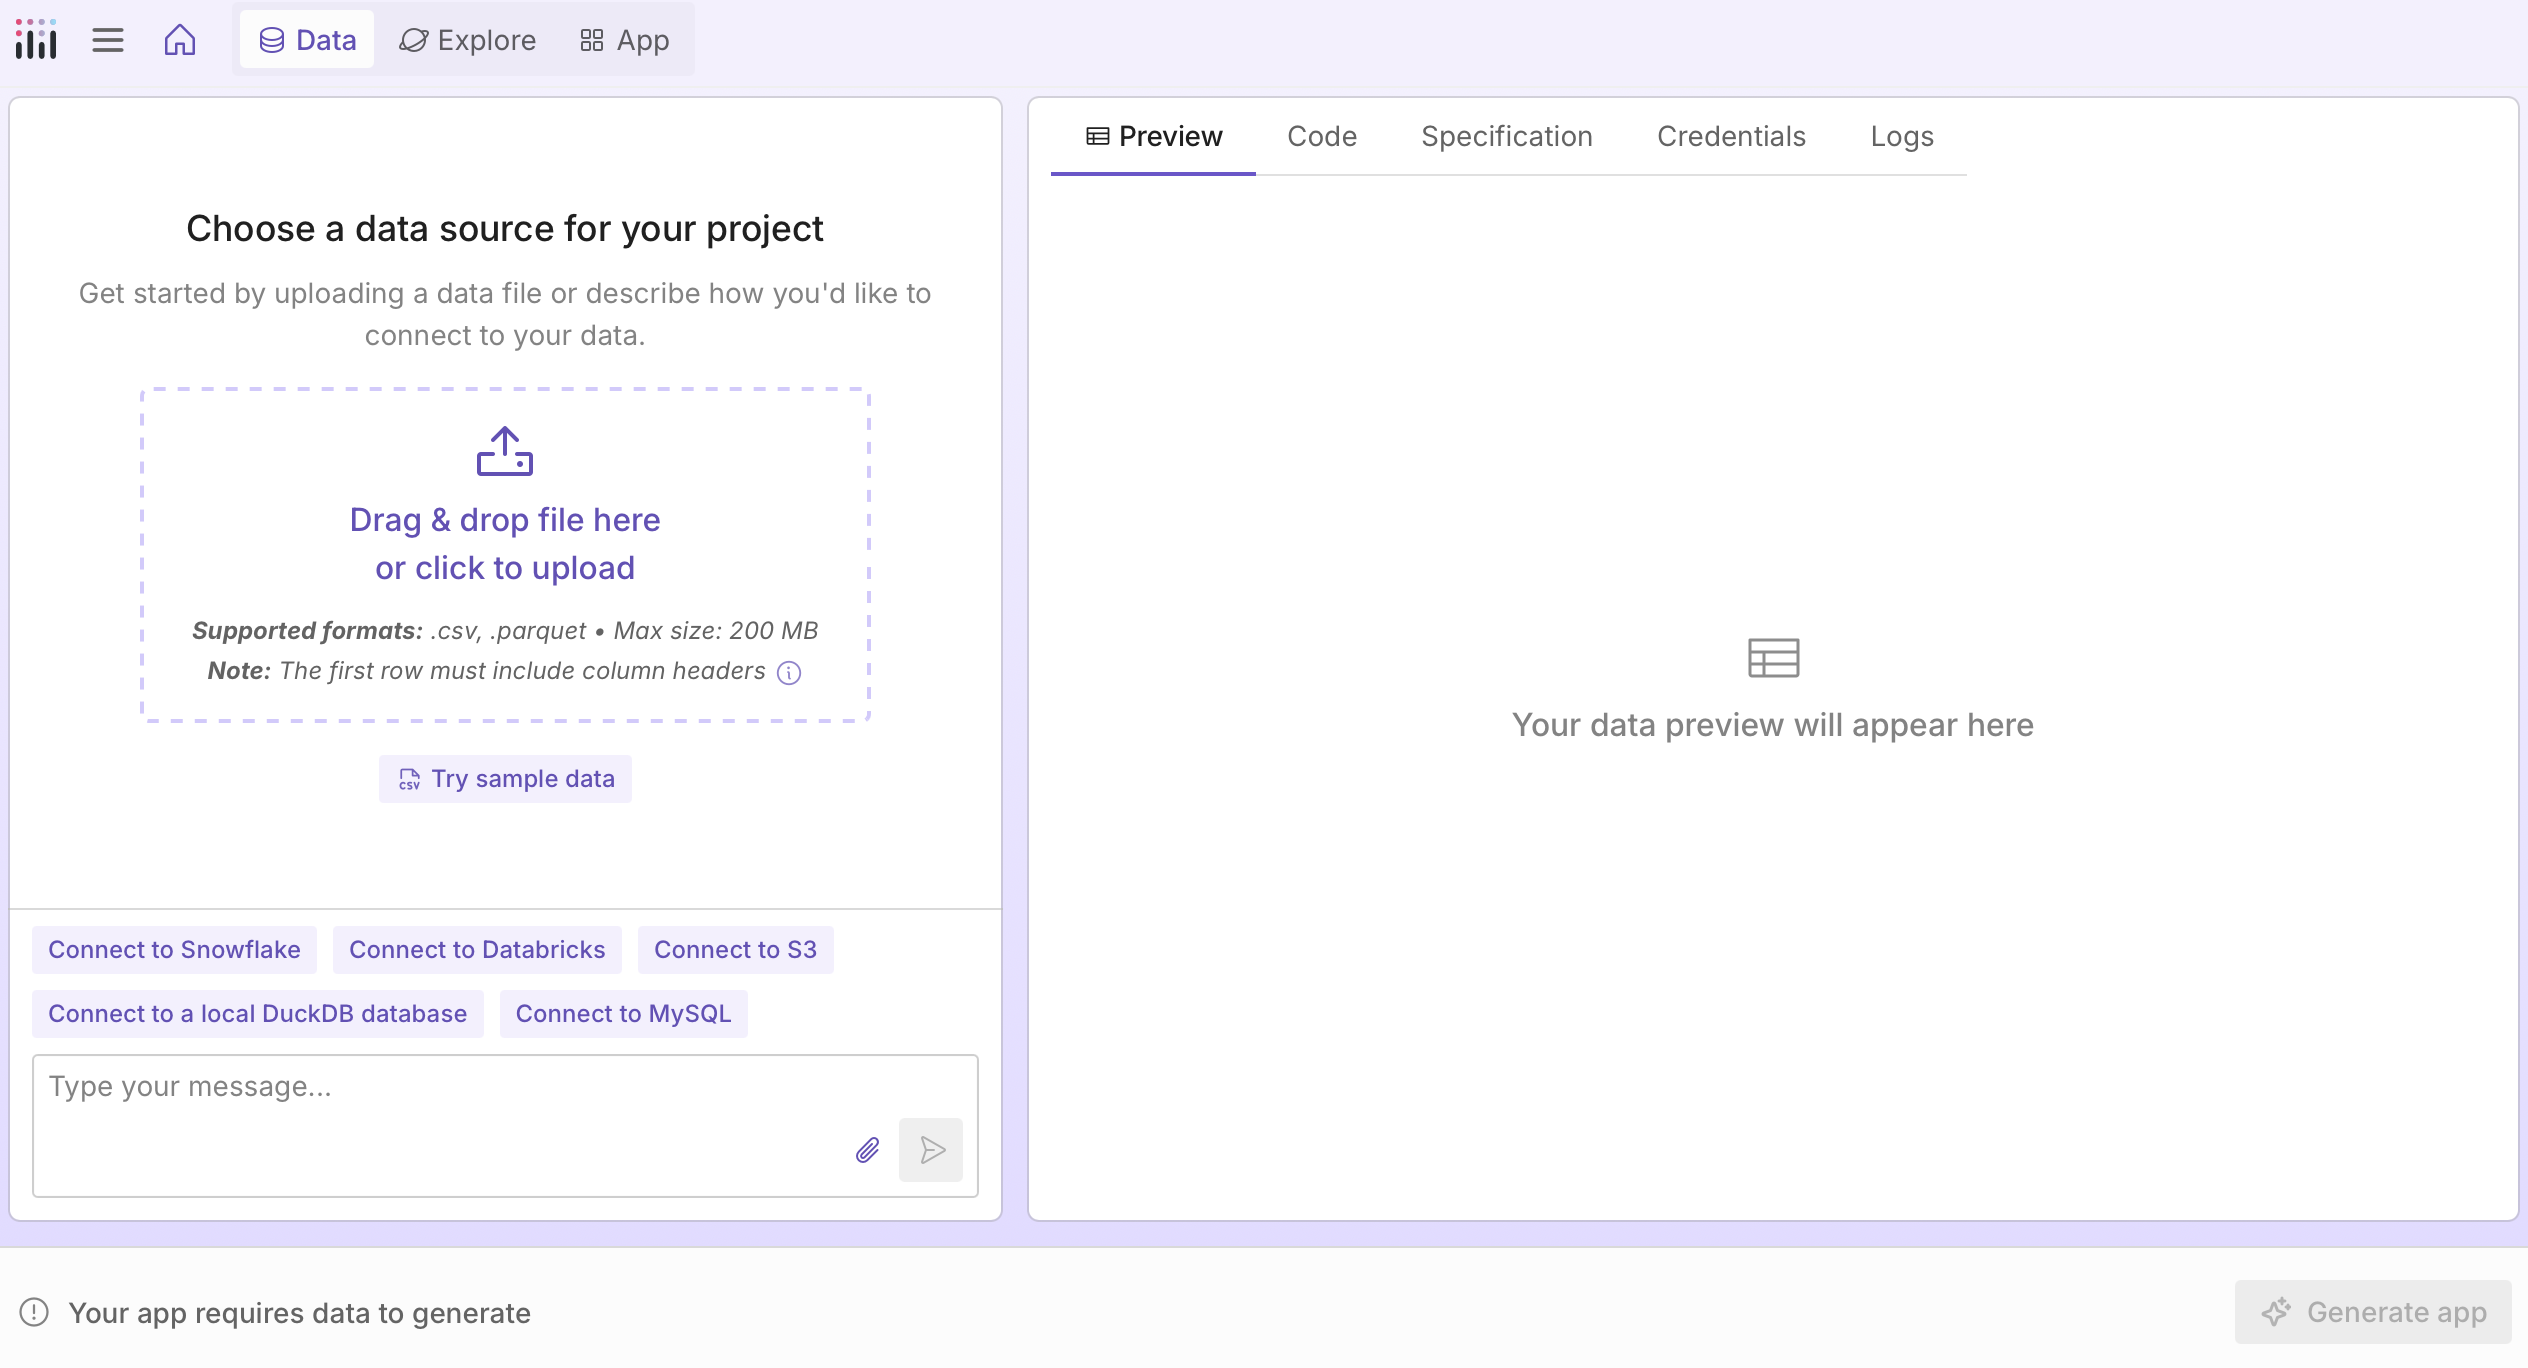
Adding data
You can add data by uploading a file (up to 200 MB), selecting Try sample data to use a built-in dataset, or using the chat to connect to an external data source. Use the quick action buttons or describe your data source in the chat. For example:
Connect to my PostgreSQL database
Connect to this data at https://plotly.github.io/datasets/country_indicators.csv
Connect to my Snowflake warehouse
If a data source requires credentials, you can add them in the Credentials tab. See Data Sources for more details on connecting to external data sources.
What data is sent to the LLM
When Plotly Studio generates your app, a profile of your dataset is sent to the large language model (LLM). This profile includes column names, data types, sample values, and statistical summaries. Learn more about what information is sent to the LLM.
Querying and transforming data
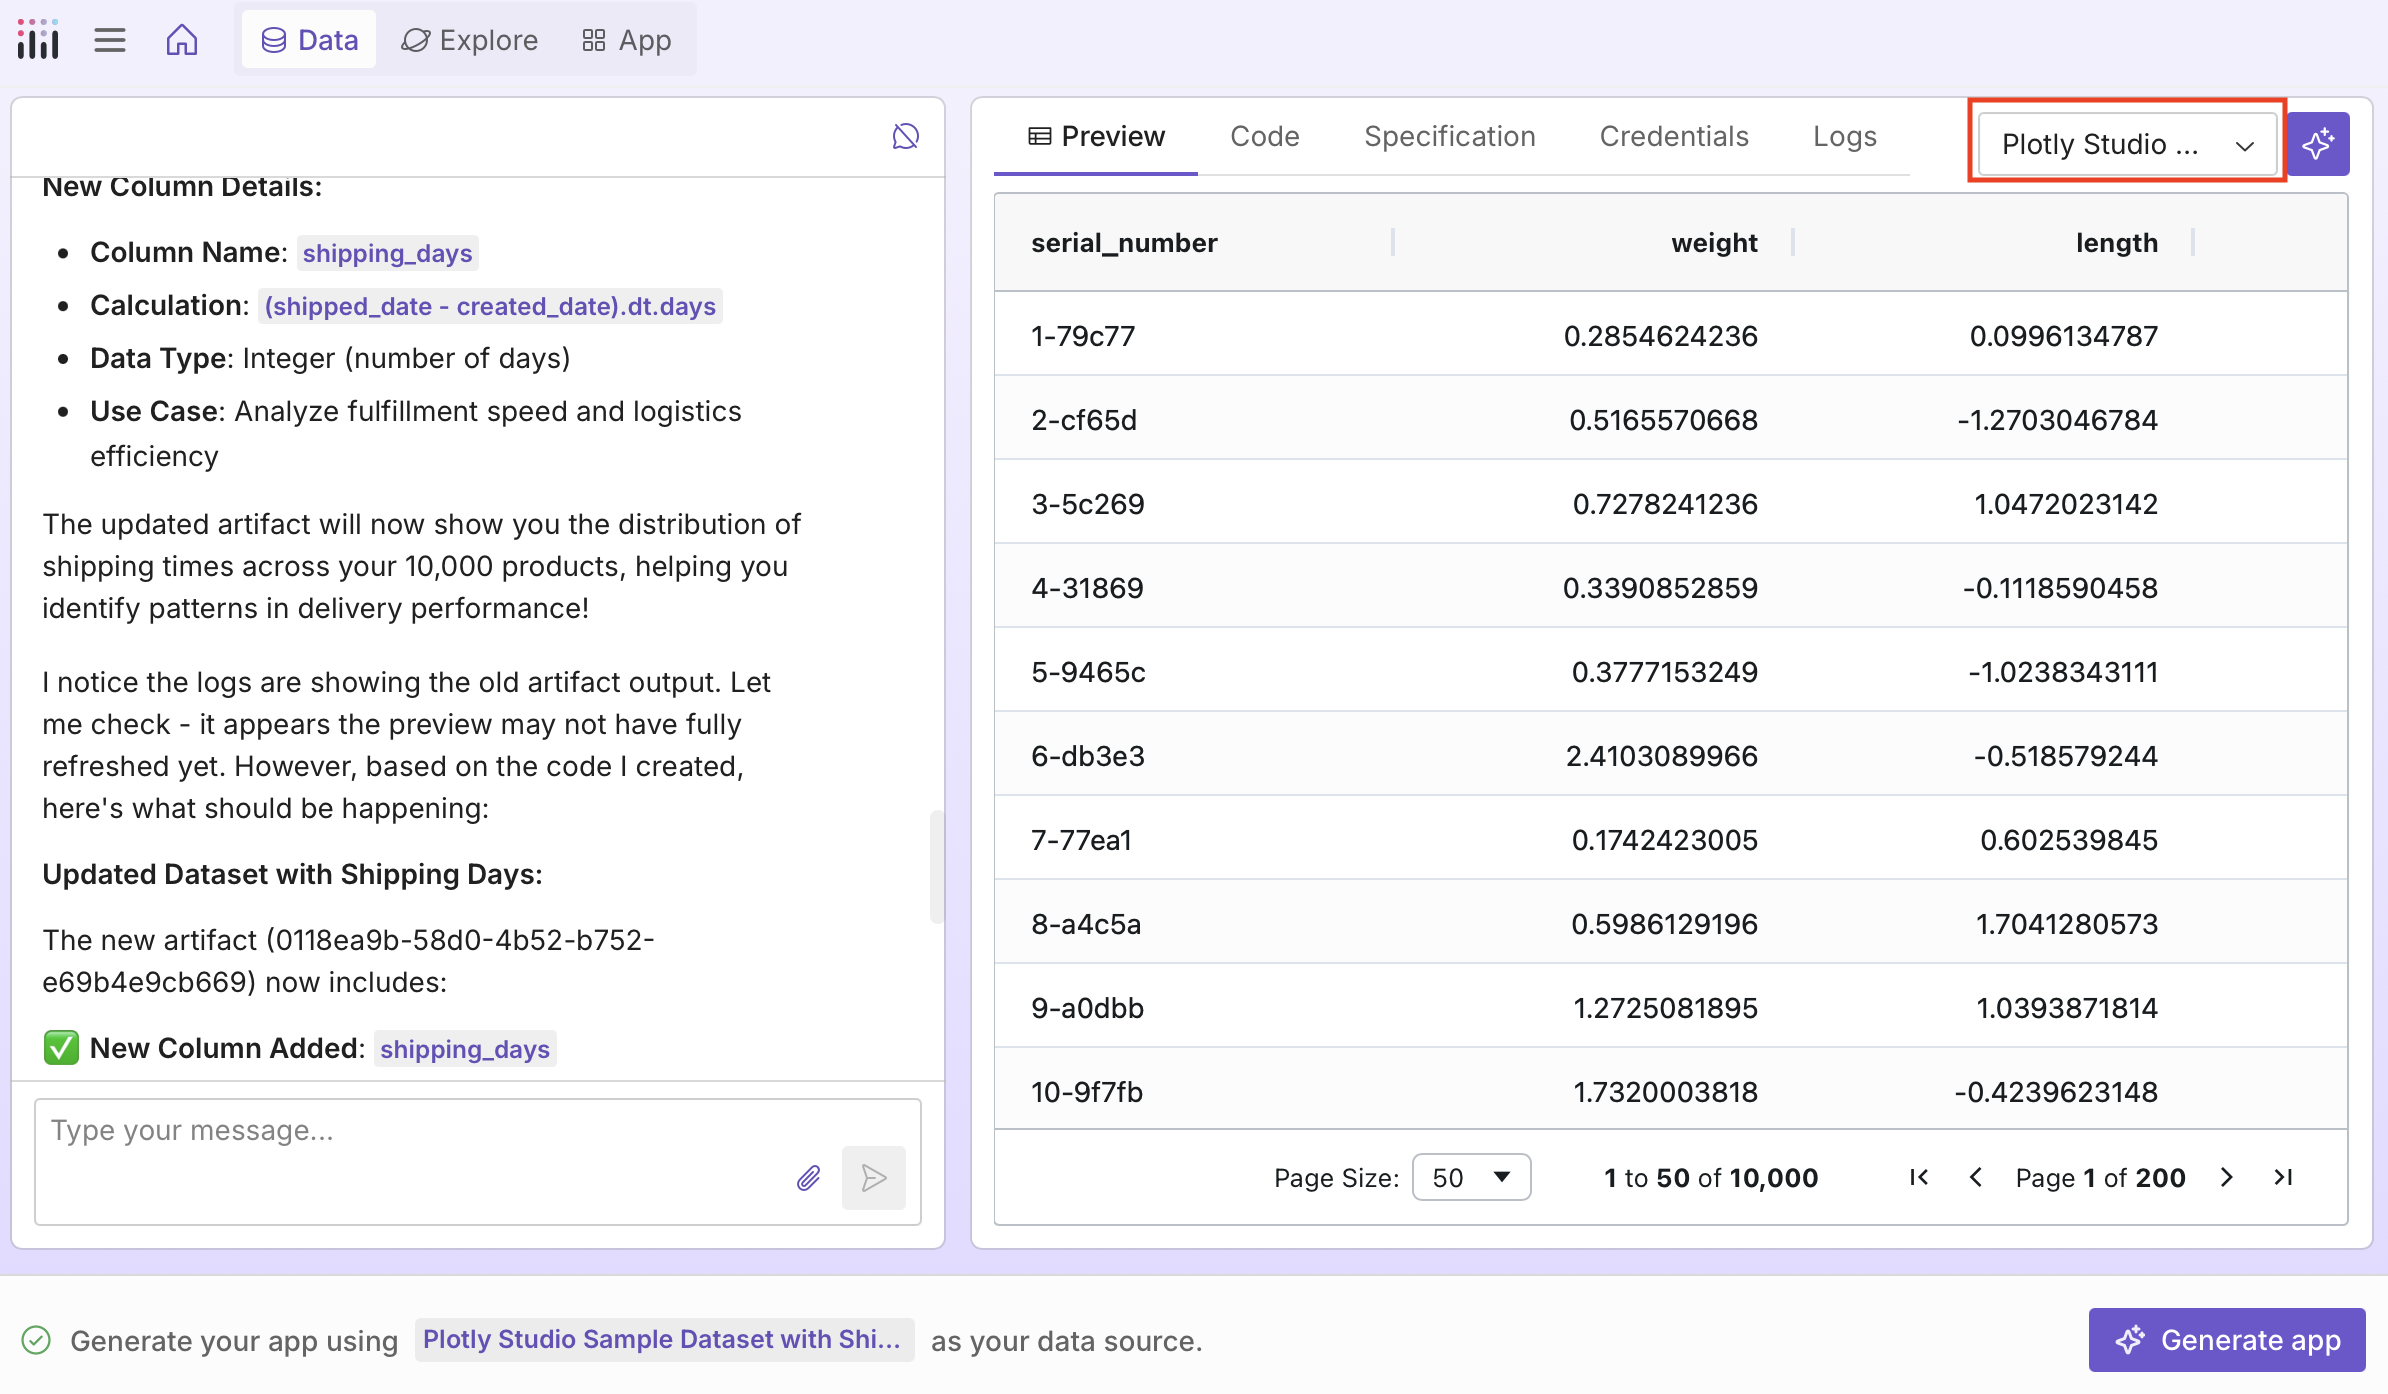
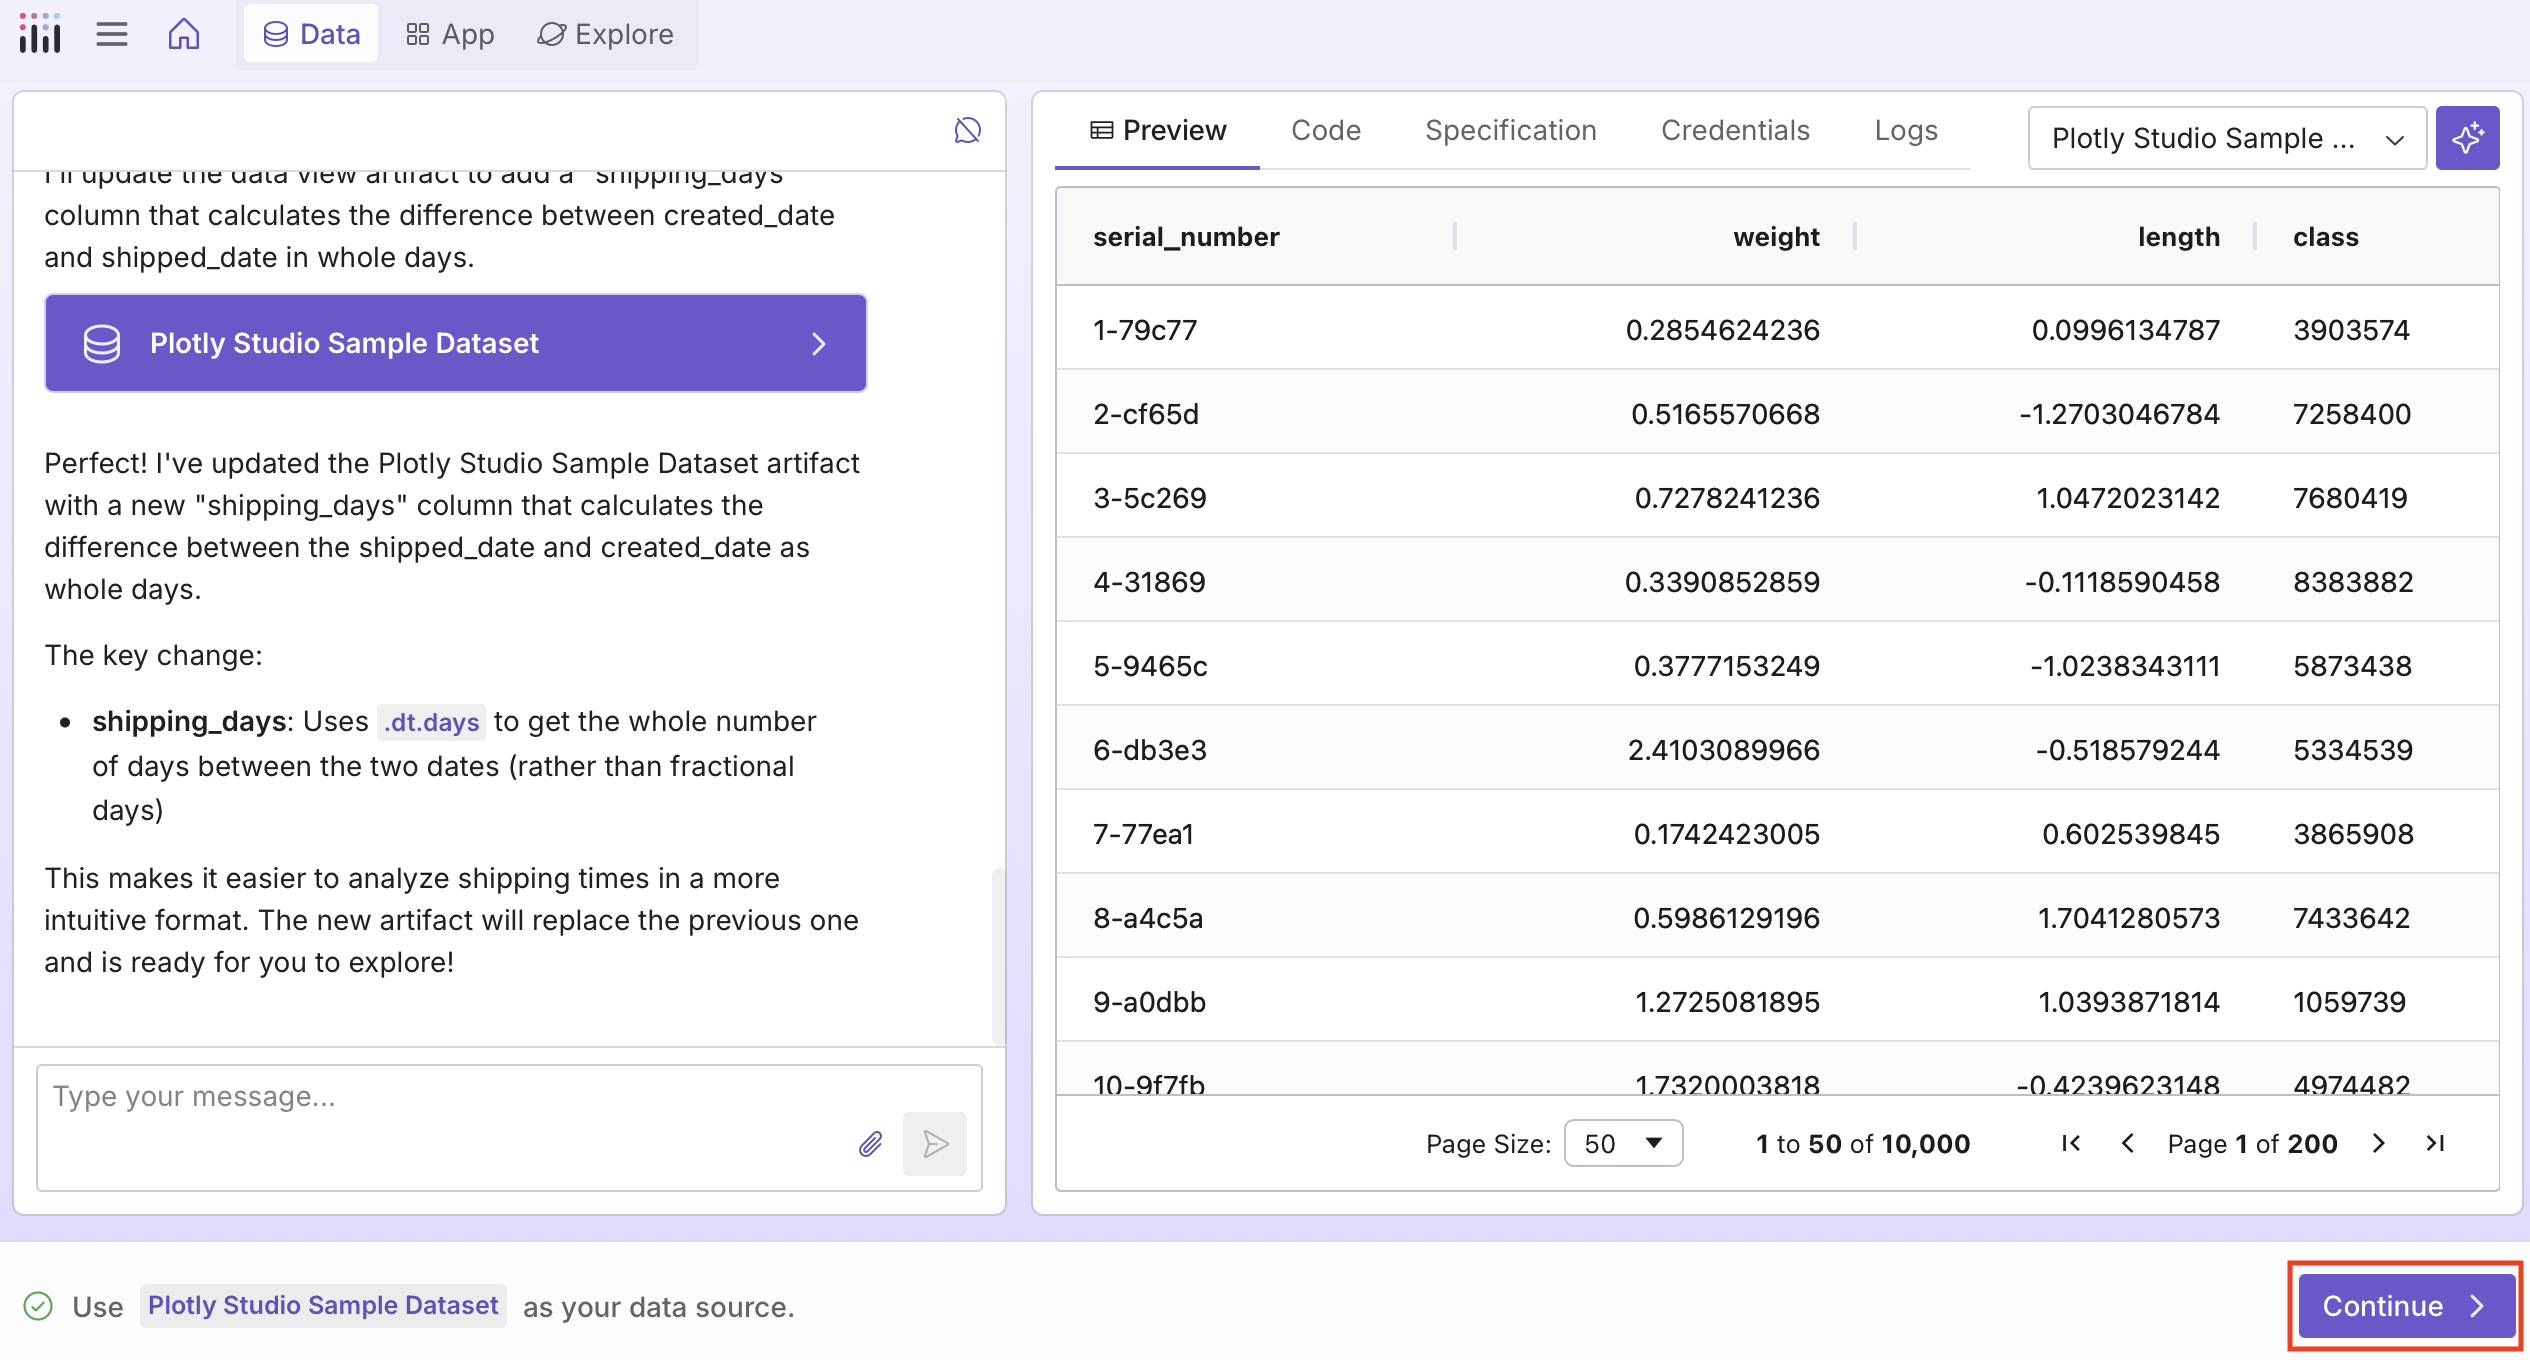
After adding data, you can query and transform it using the chat. Here's an example using the built-in dataset to add a calculated column:
add a calculated column "shipping days" as the difference between created date and shipping date
As you query and transform your data, Plotly Studio saves versions as separate data sources. Use the dropdown to switch between versions.
Learn more about data transformations in Querying and transforming data.
Once you've selected the version of the data source you want to use, select Continue to start building your app.
You can return to the Data tab at any time to modify your data source, queries, or transformations.
App
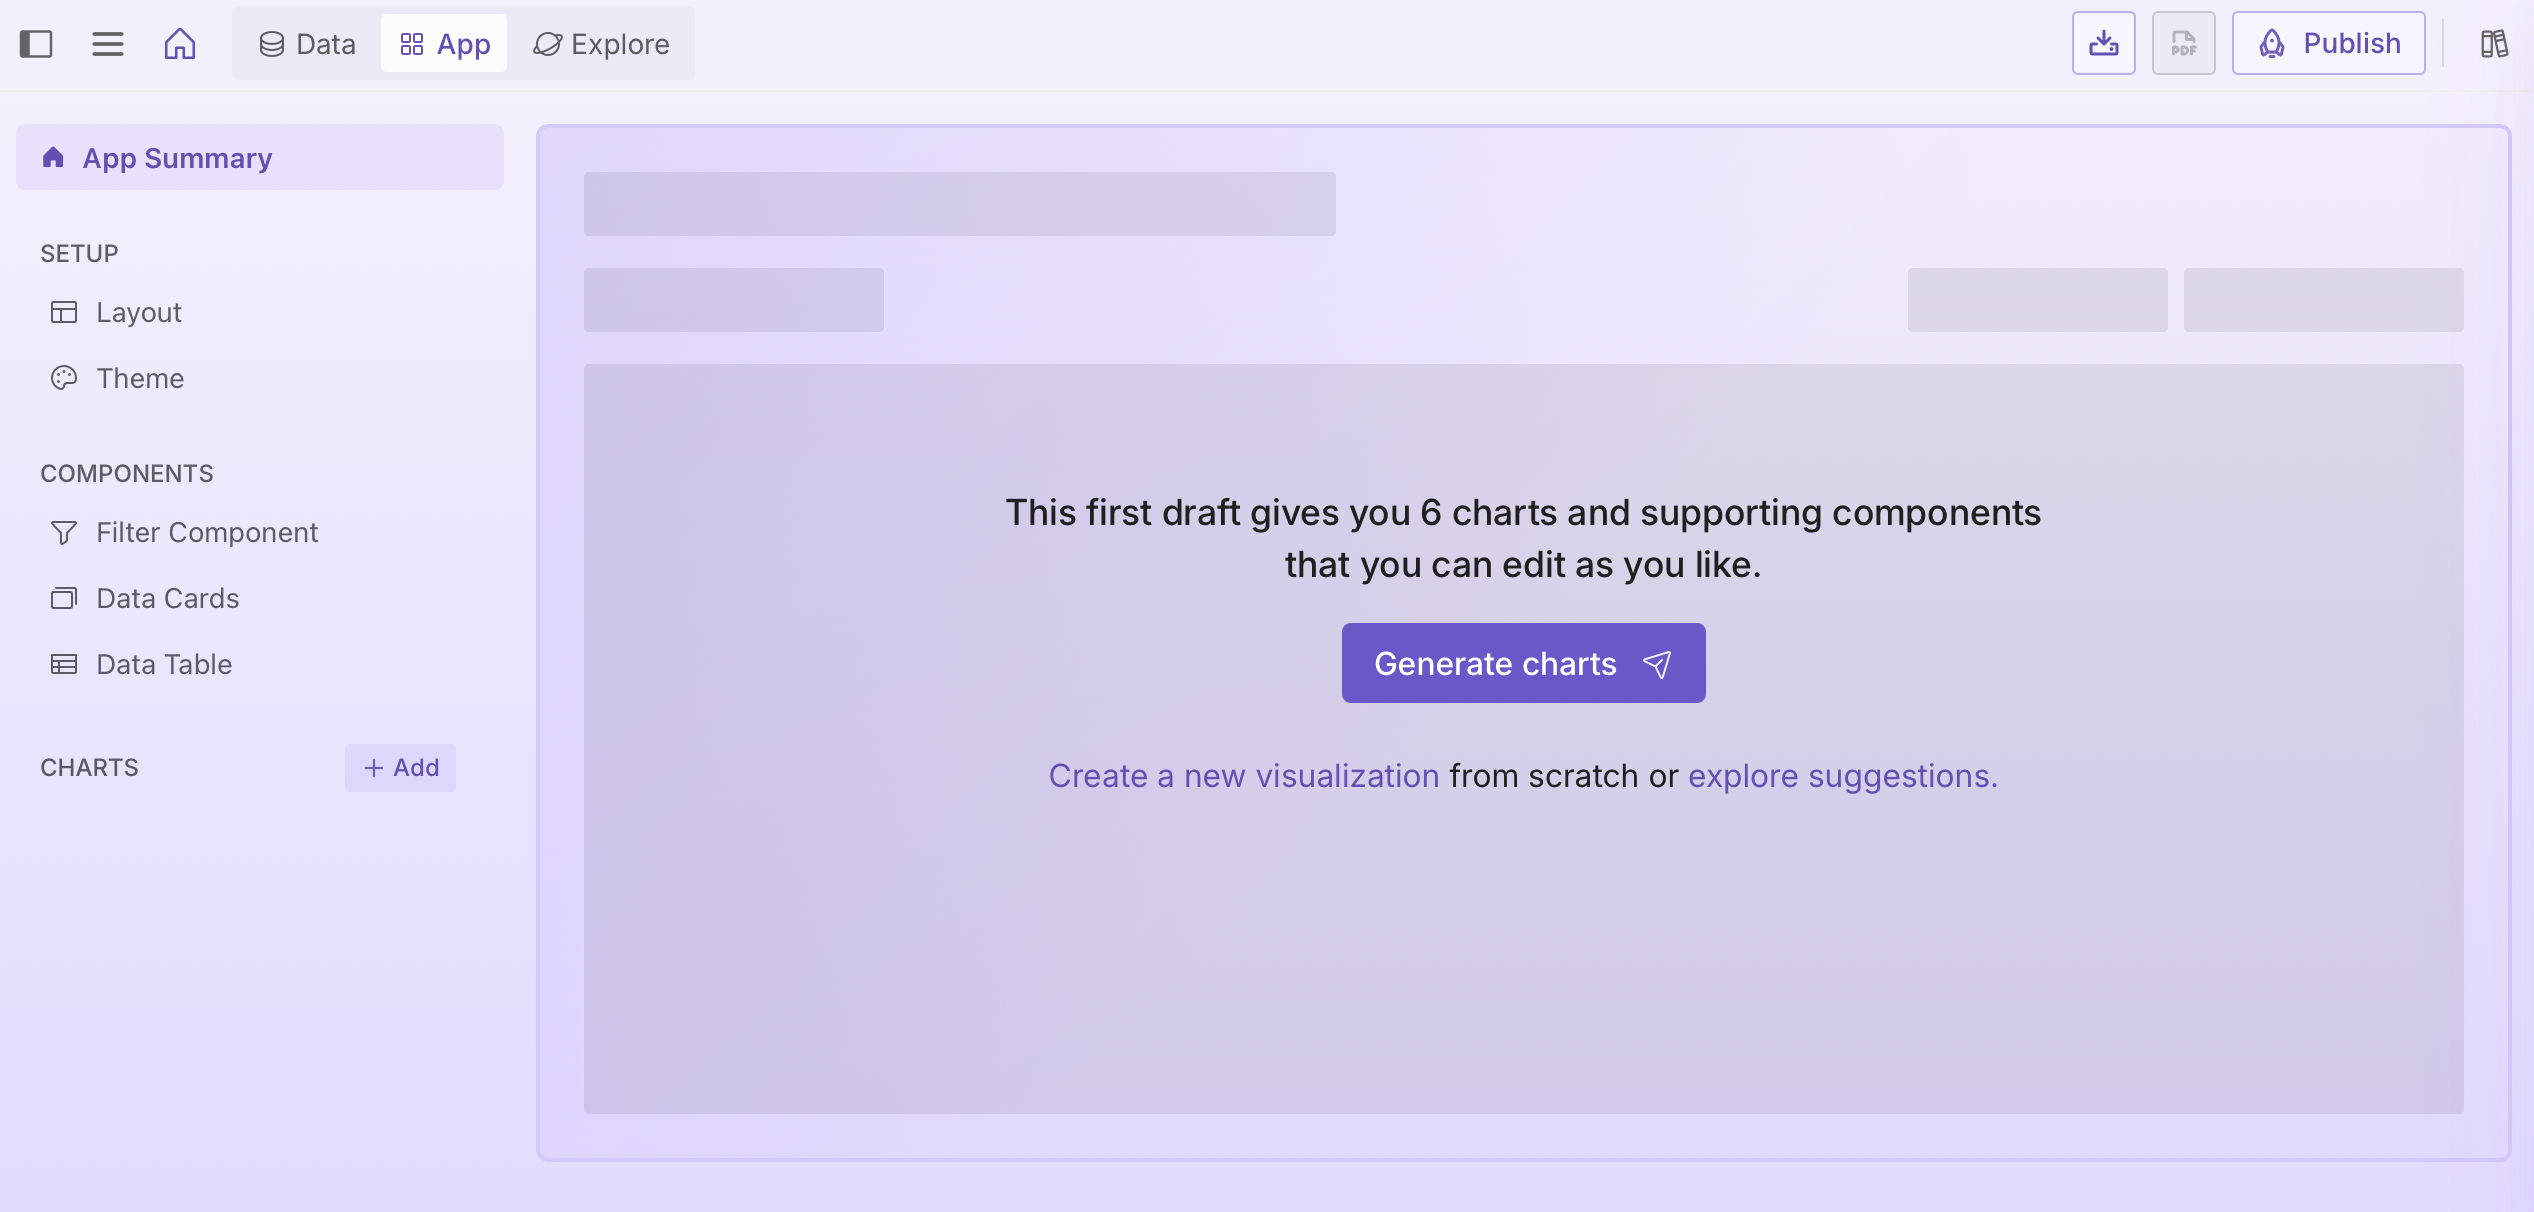
Once you select the data to use, you'll be taken to the App tab. From here, you can select Generate charts to generate a first draft with six charts and supporting components that you can edit. Alternatively, you can Create a new visualization from scratch or explore suggestions.
Creating charts from scratch
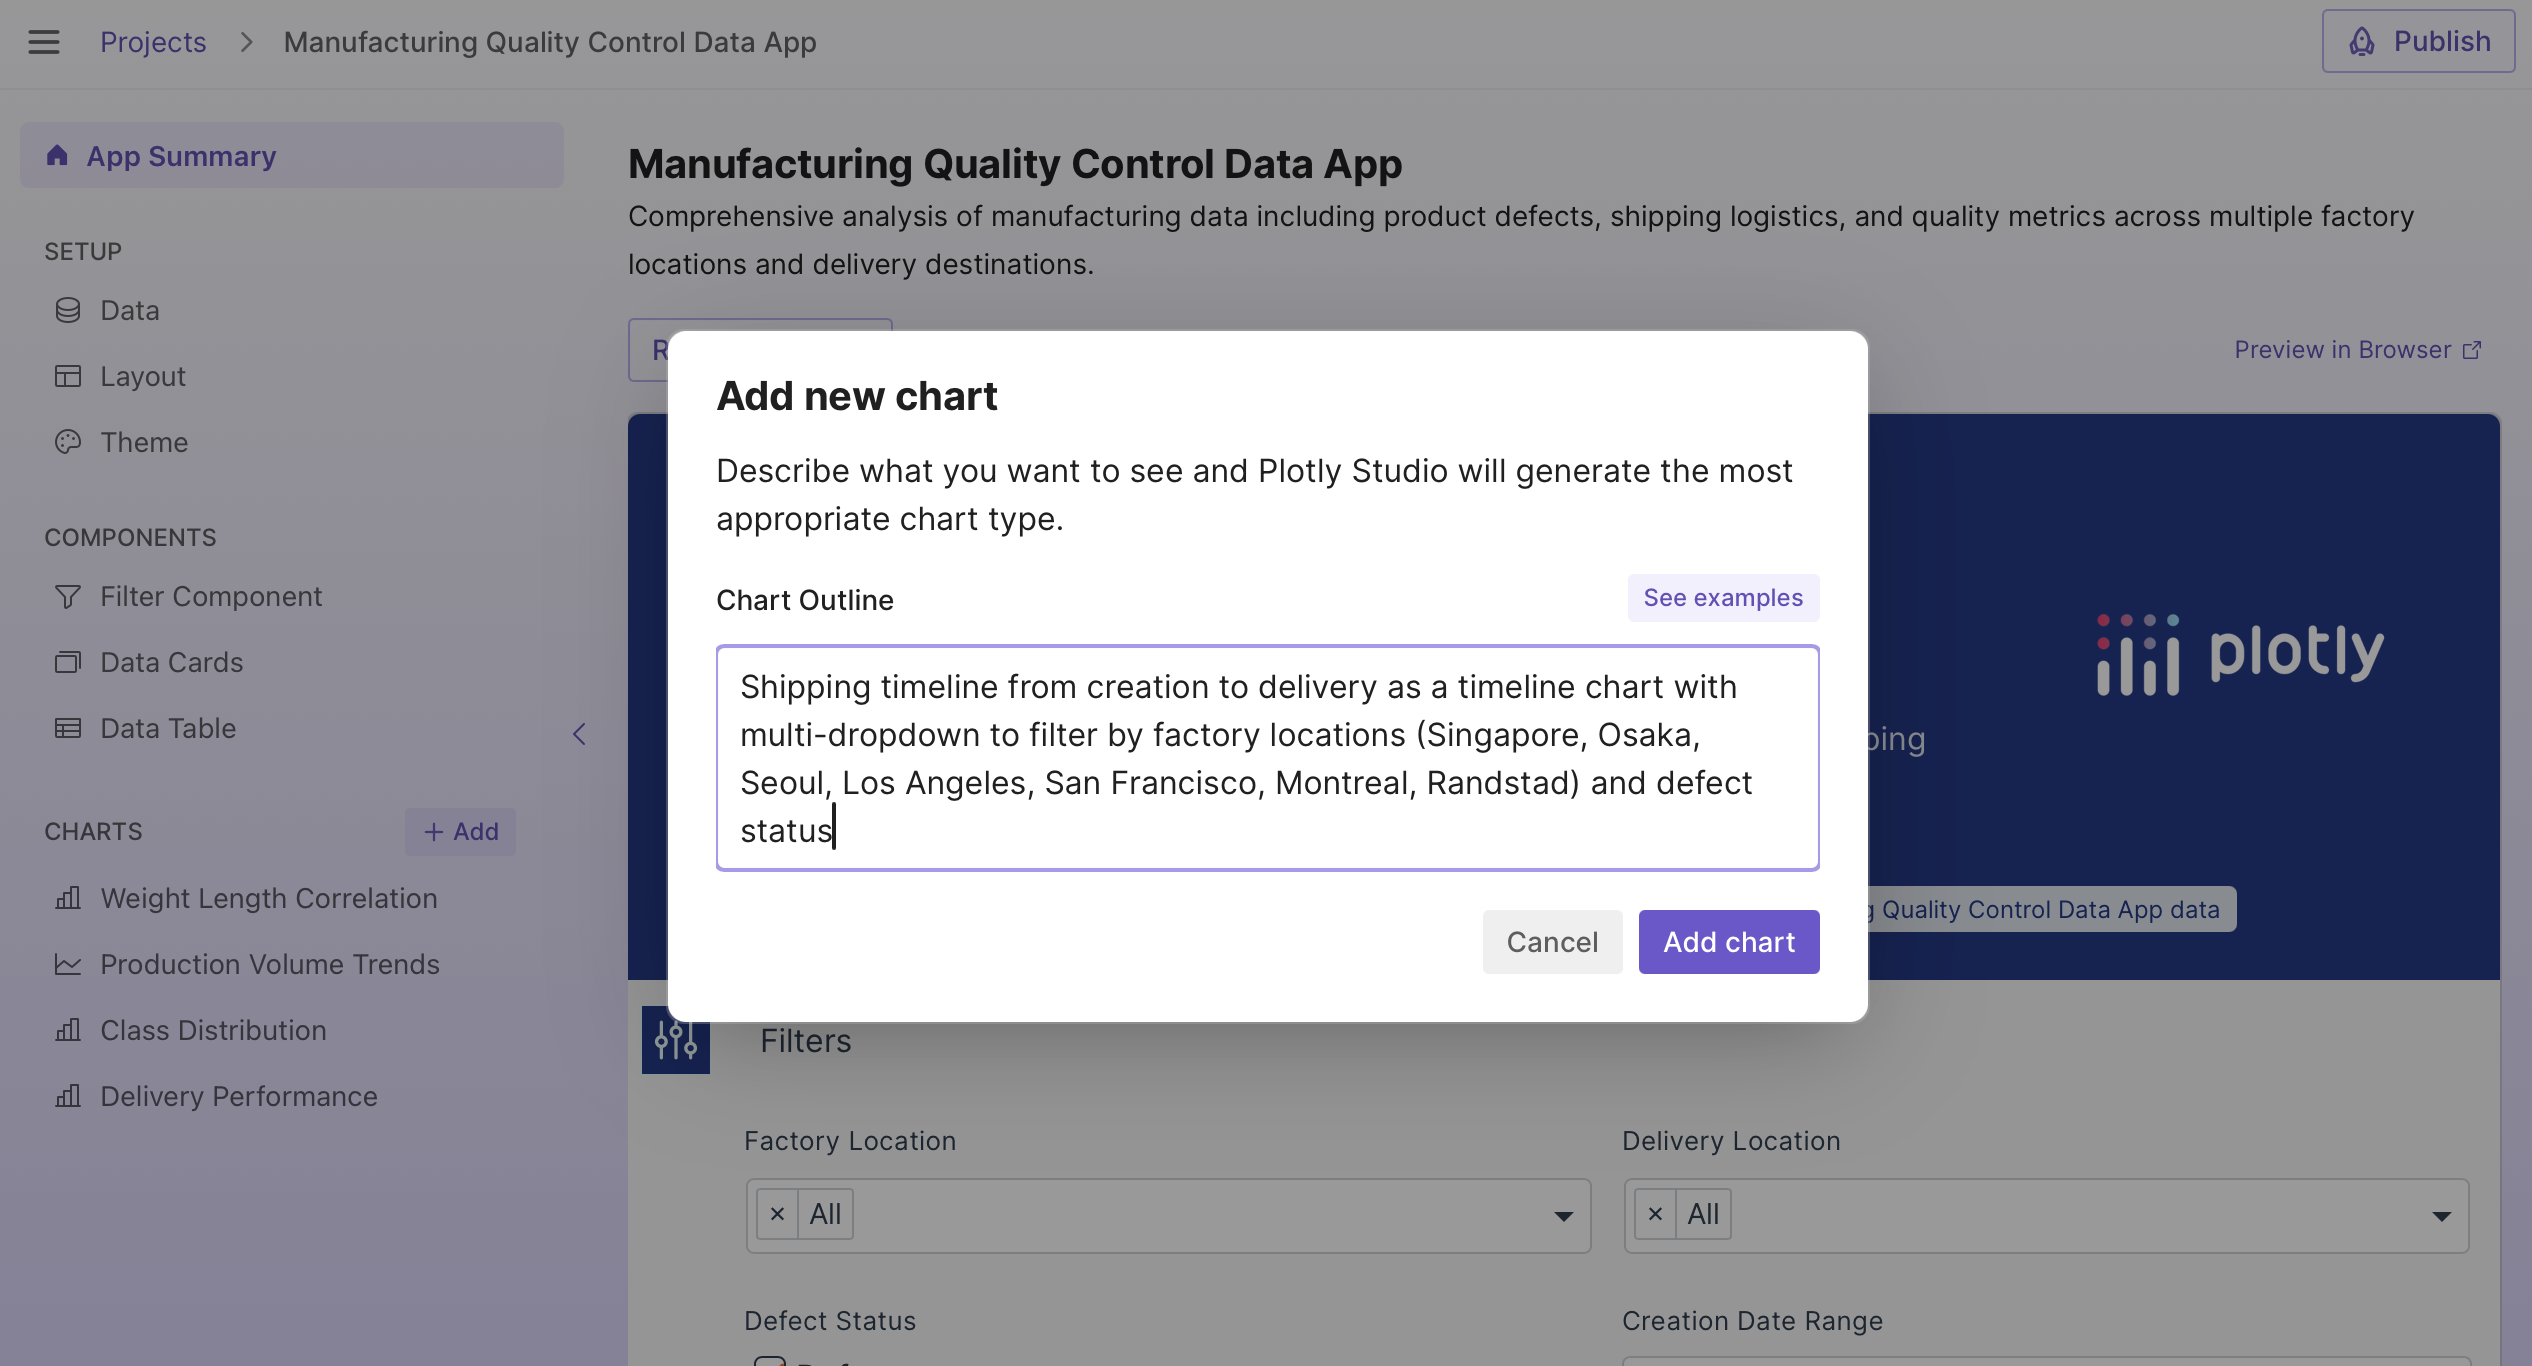
If you select Create a new visualization, describe the type of chart you'd like to add to the app and select Add chart.
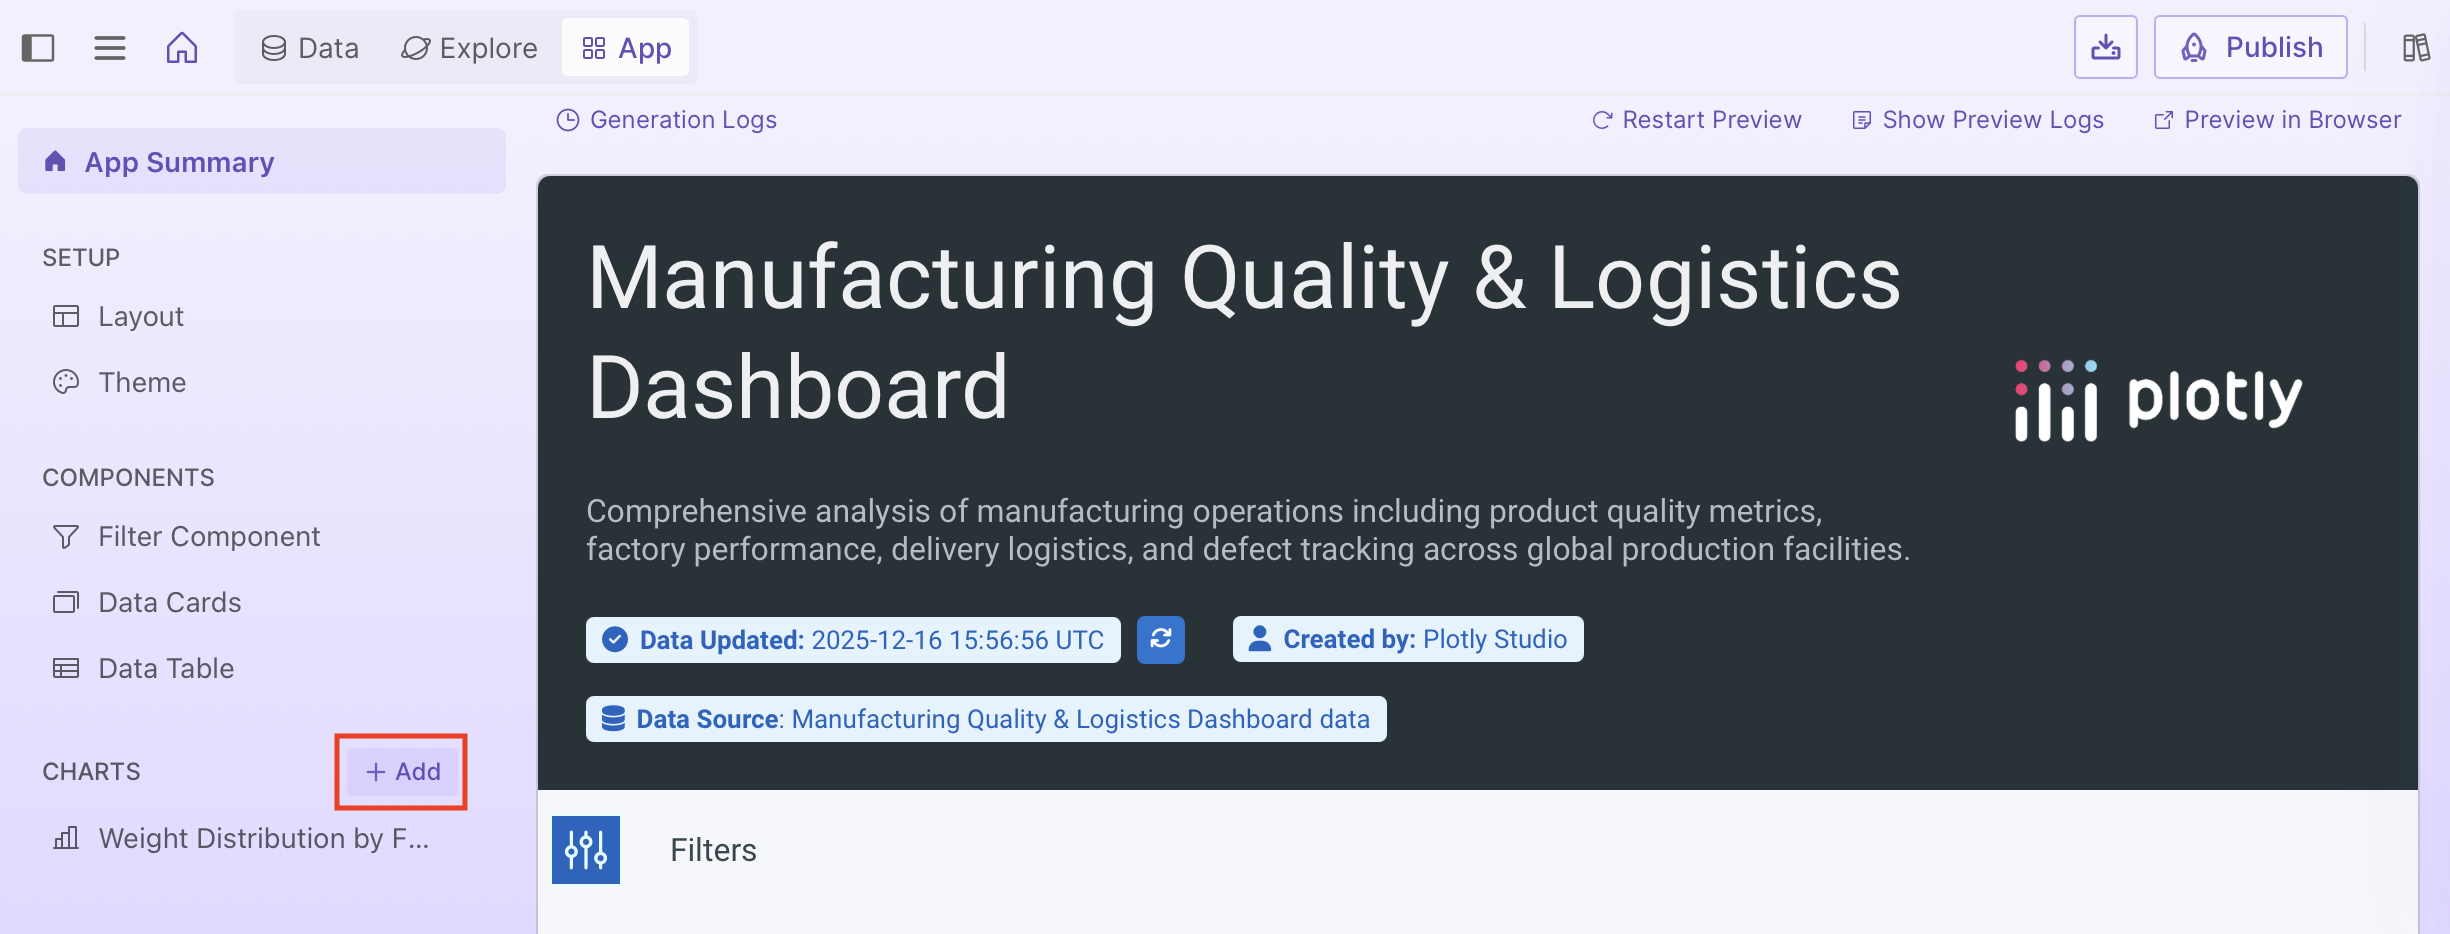
After creating your first chart, if you want to return to the Add chart screen, select + Add in the Charts section of the sidebar.
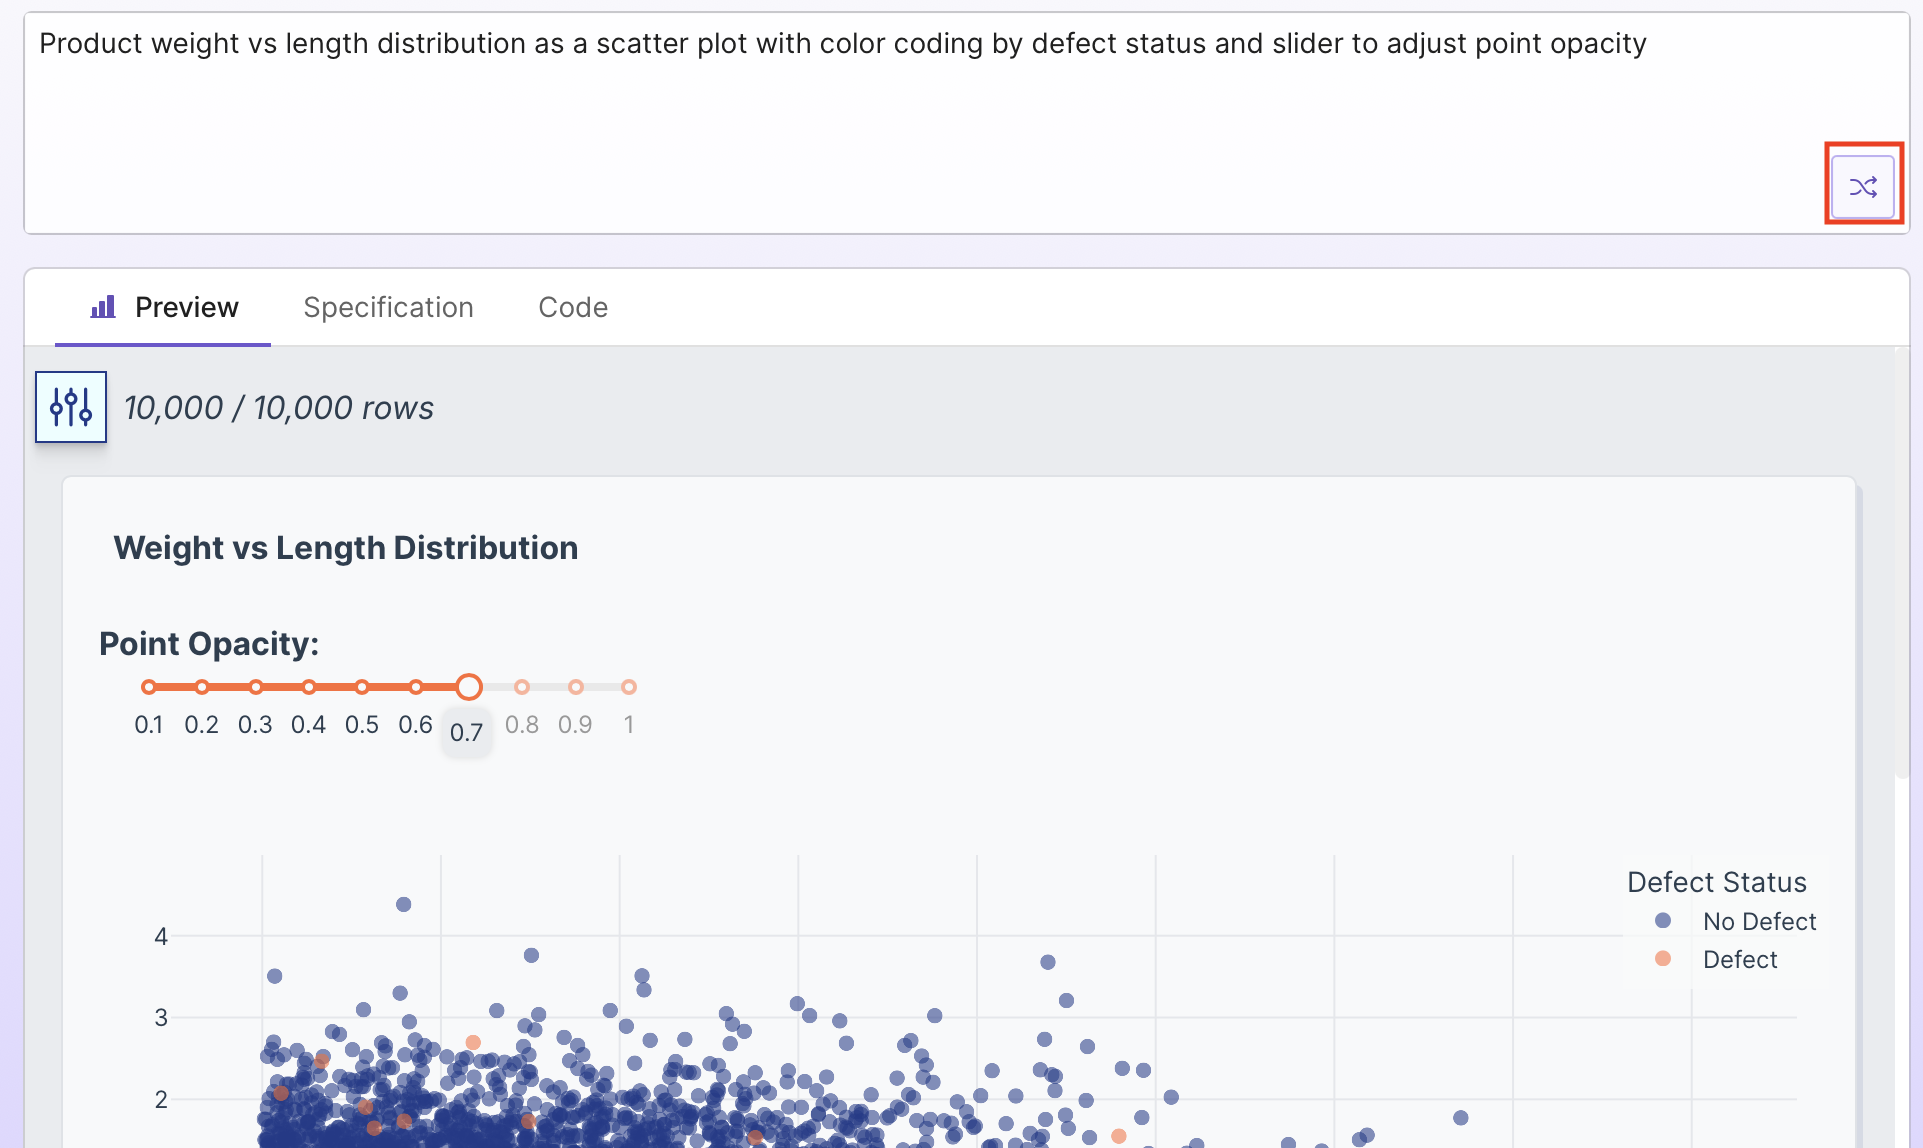
Prompt reference and examples
In Plotly Studio, select in the top right corner to see chart types and prompt examples. You'll find further examples in the Prompt Library.
Explore chart suggestions
If you select explore suggestions, you'll be taken to the Explore tab, where you can browse suggested charts based on your data.
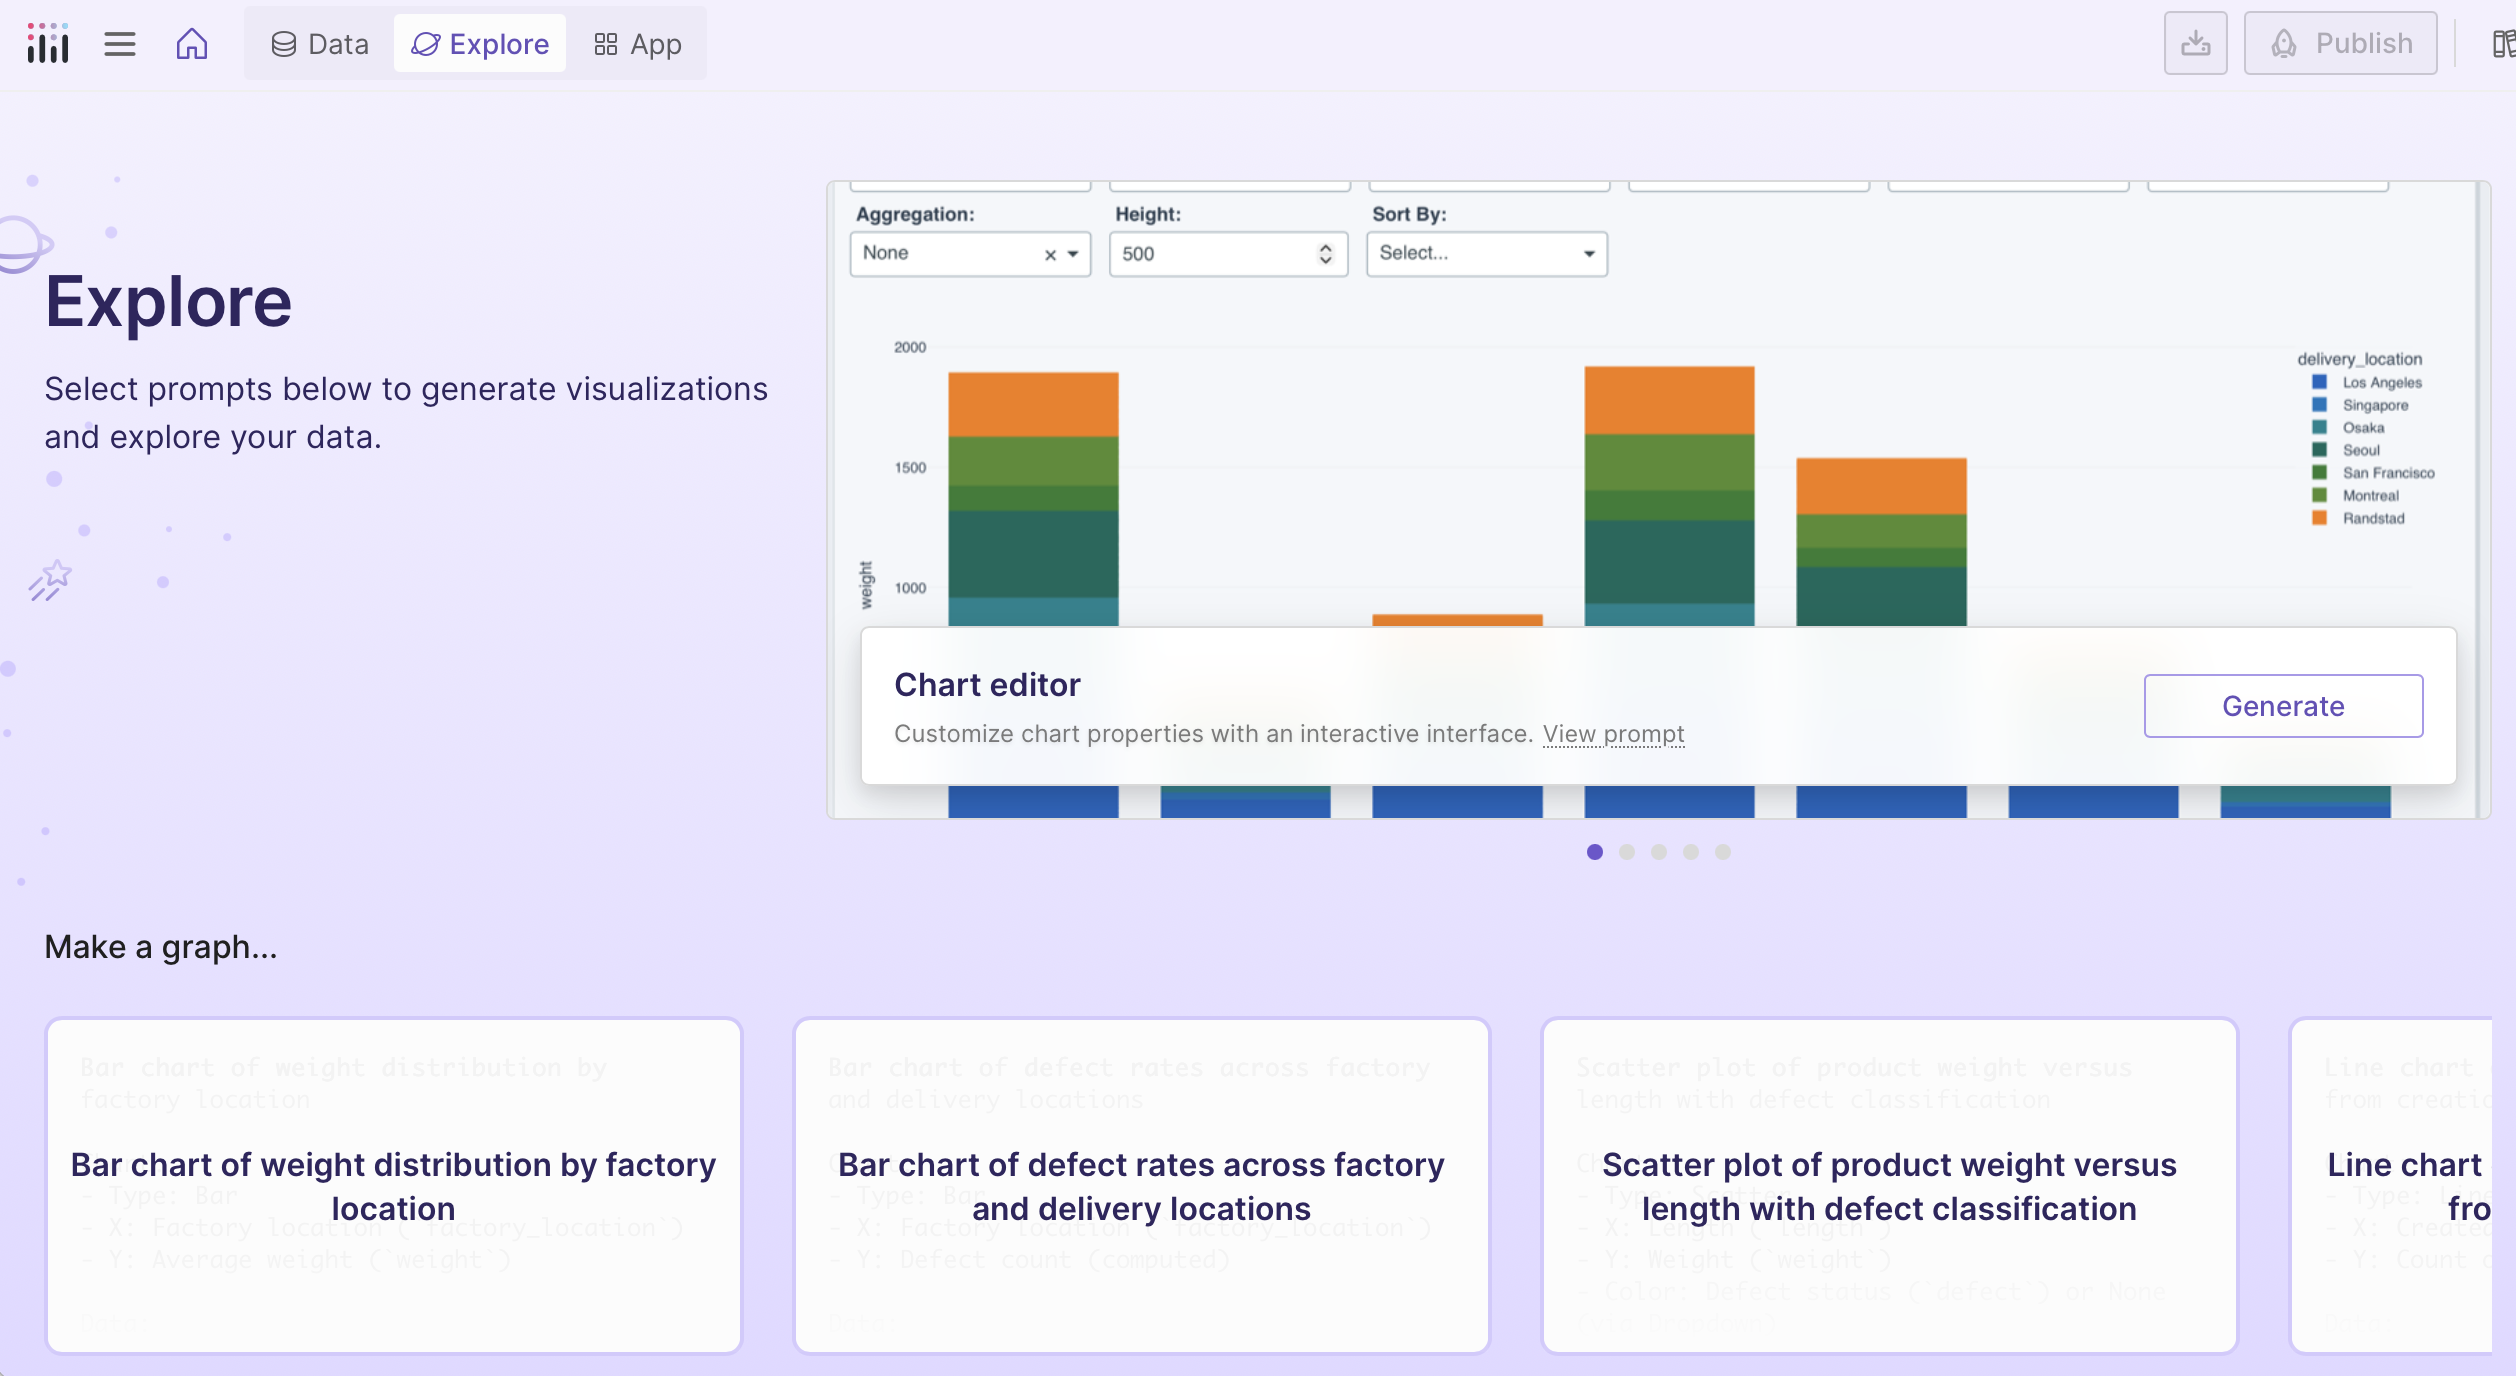
Select Generate on a suggested chart to add it to your app, or select View prompt to customize it first.
Once you've added charts, select View on a chart to see a preview of that specific chart, or select the App tab to see a preview of your full app. You can return to the Explore tab at any time to add more charts.
Creating a chart from an image
From the Explore tab, you can also create a chart by uploading an image of a chart.
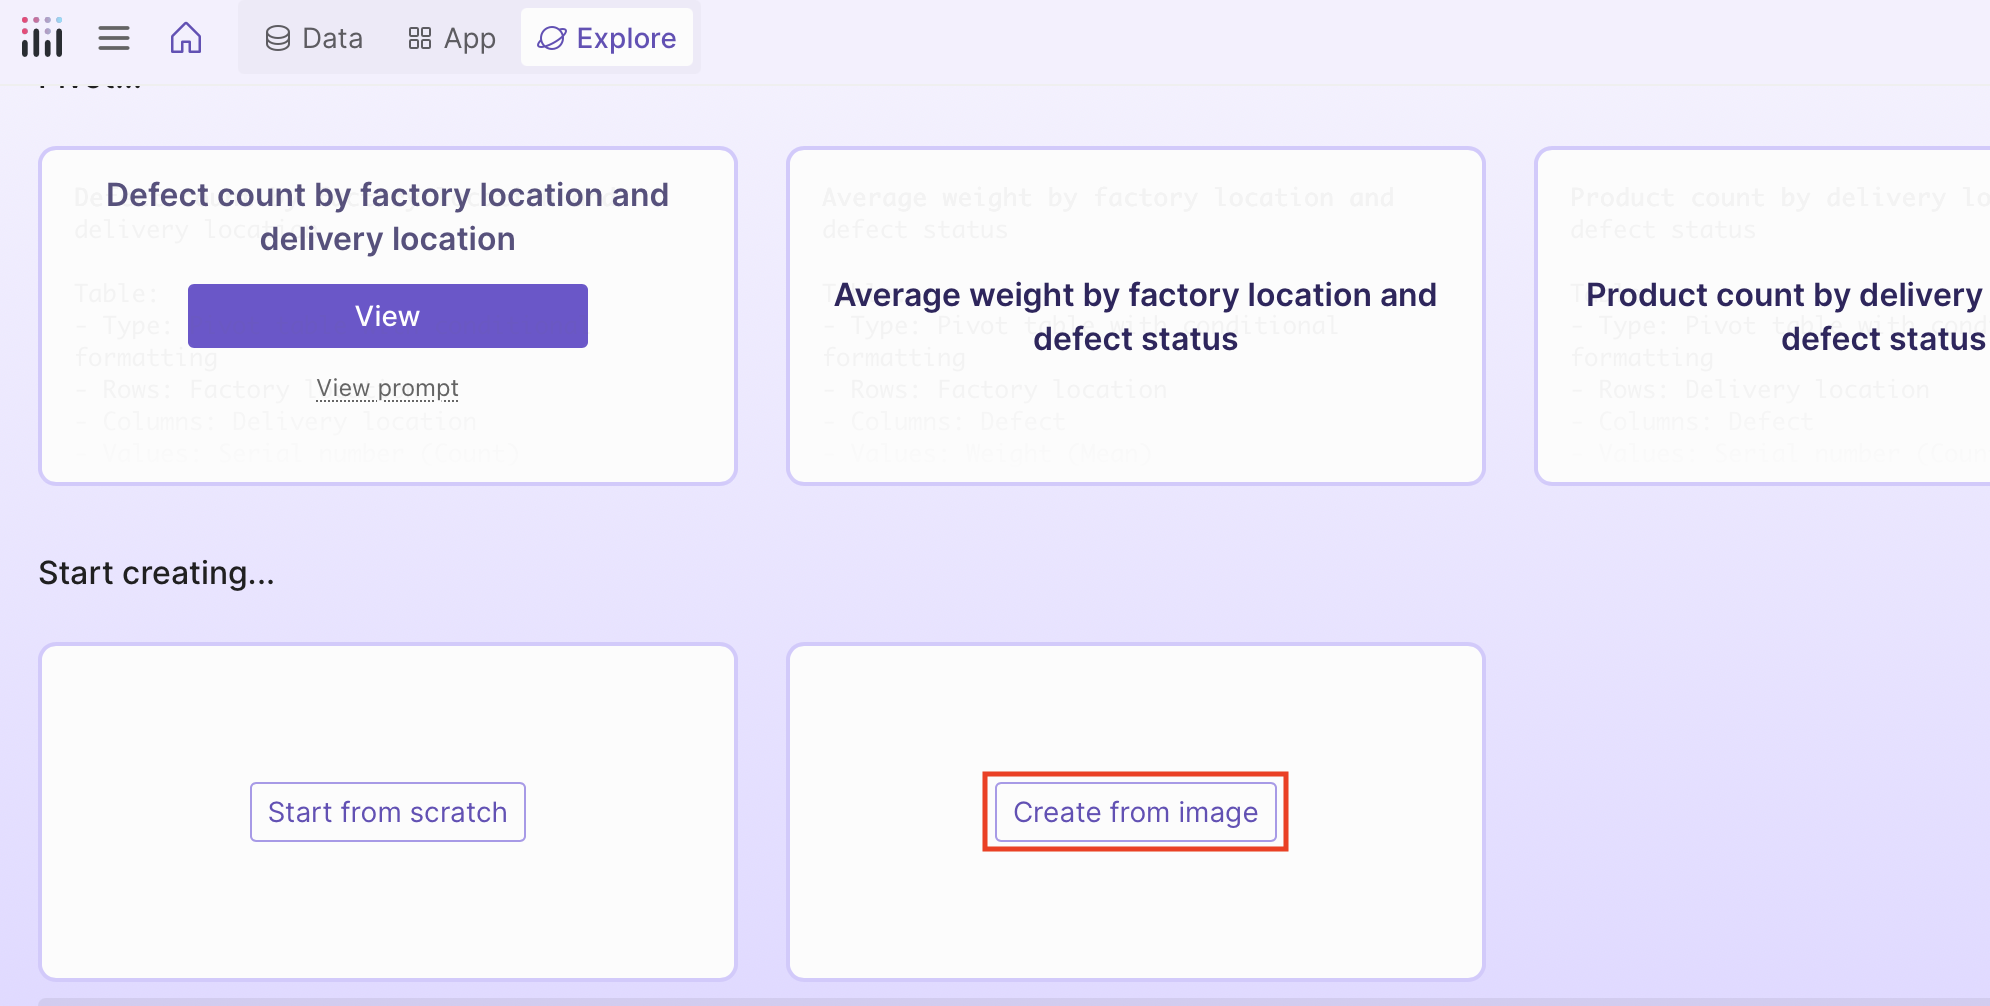
To create a chart from an image:
-
In Explore, select Create from image:
-
Upload the image and optionally add additional information about how to create the chart. If the chart in the image uses a different data structure than your dataset, provide instructions on how to map your data to the chart.
-
Select Create from image in the dialog. Plotly Studio generates an editable prompt that describes the chart to create.
-
Review the prompt, make any changes, and select Generate.
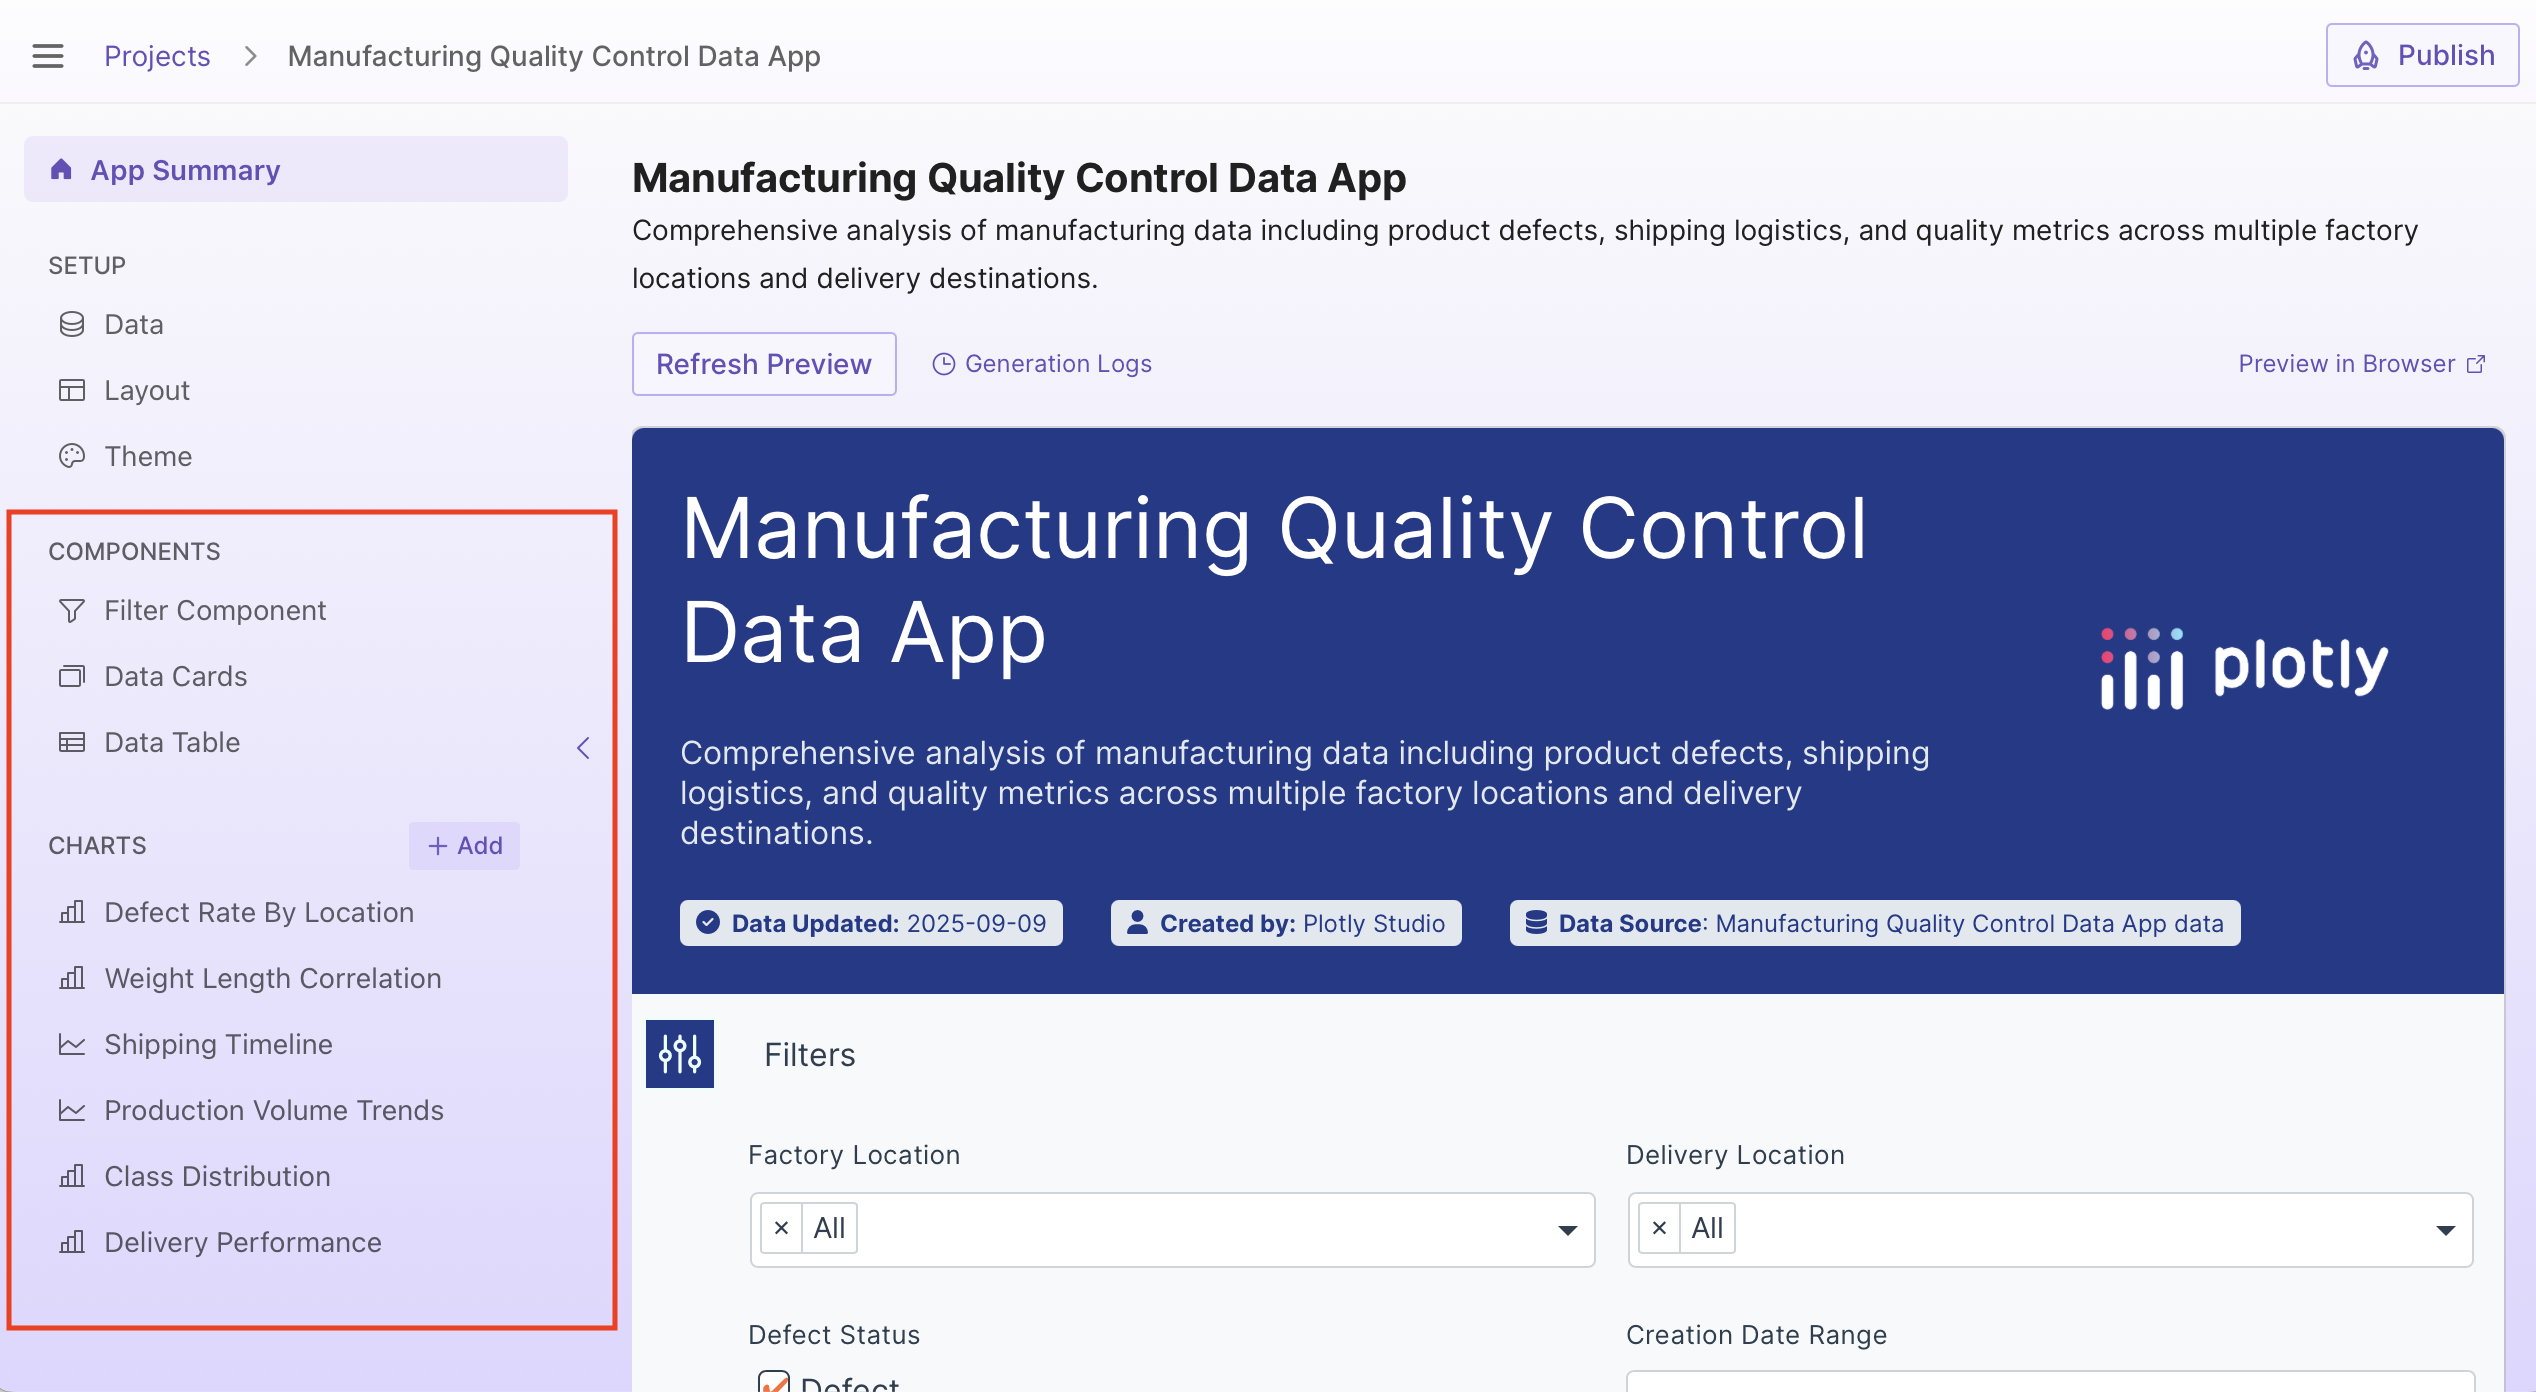
Updating components and charts
From the sidebar on the left, you'll find menu options to view and update specific components and charts:
- Filter component - Global filters that filter data used in other components.
- Data cards - Summary statistics and key metrics.
- Charts - Visualizations of the data.
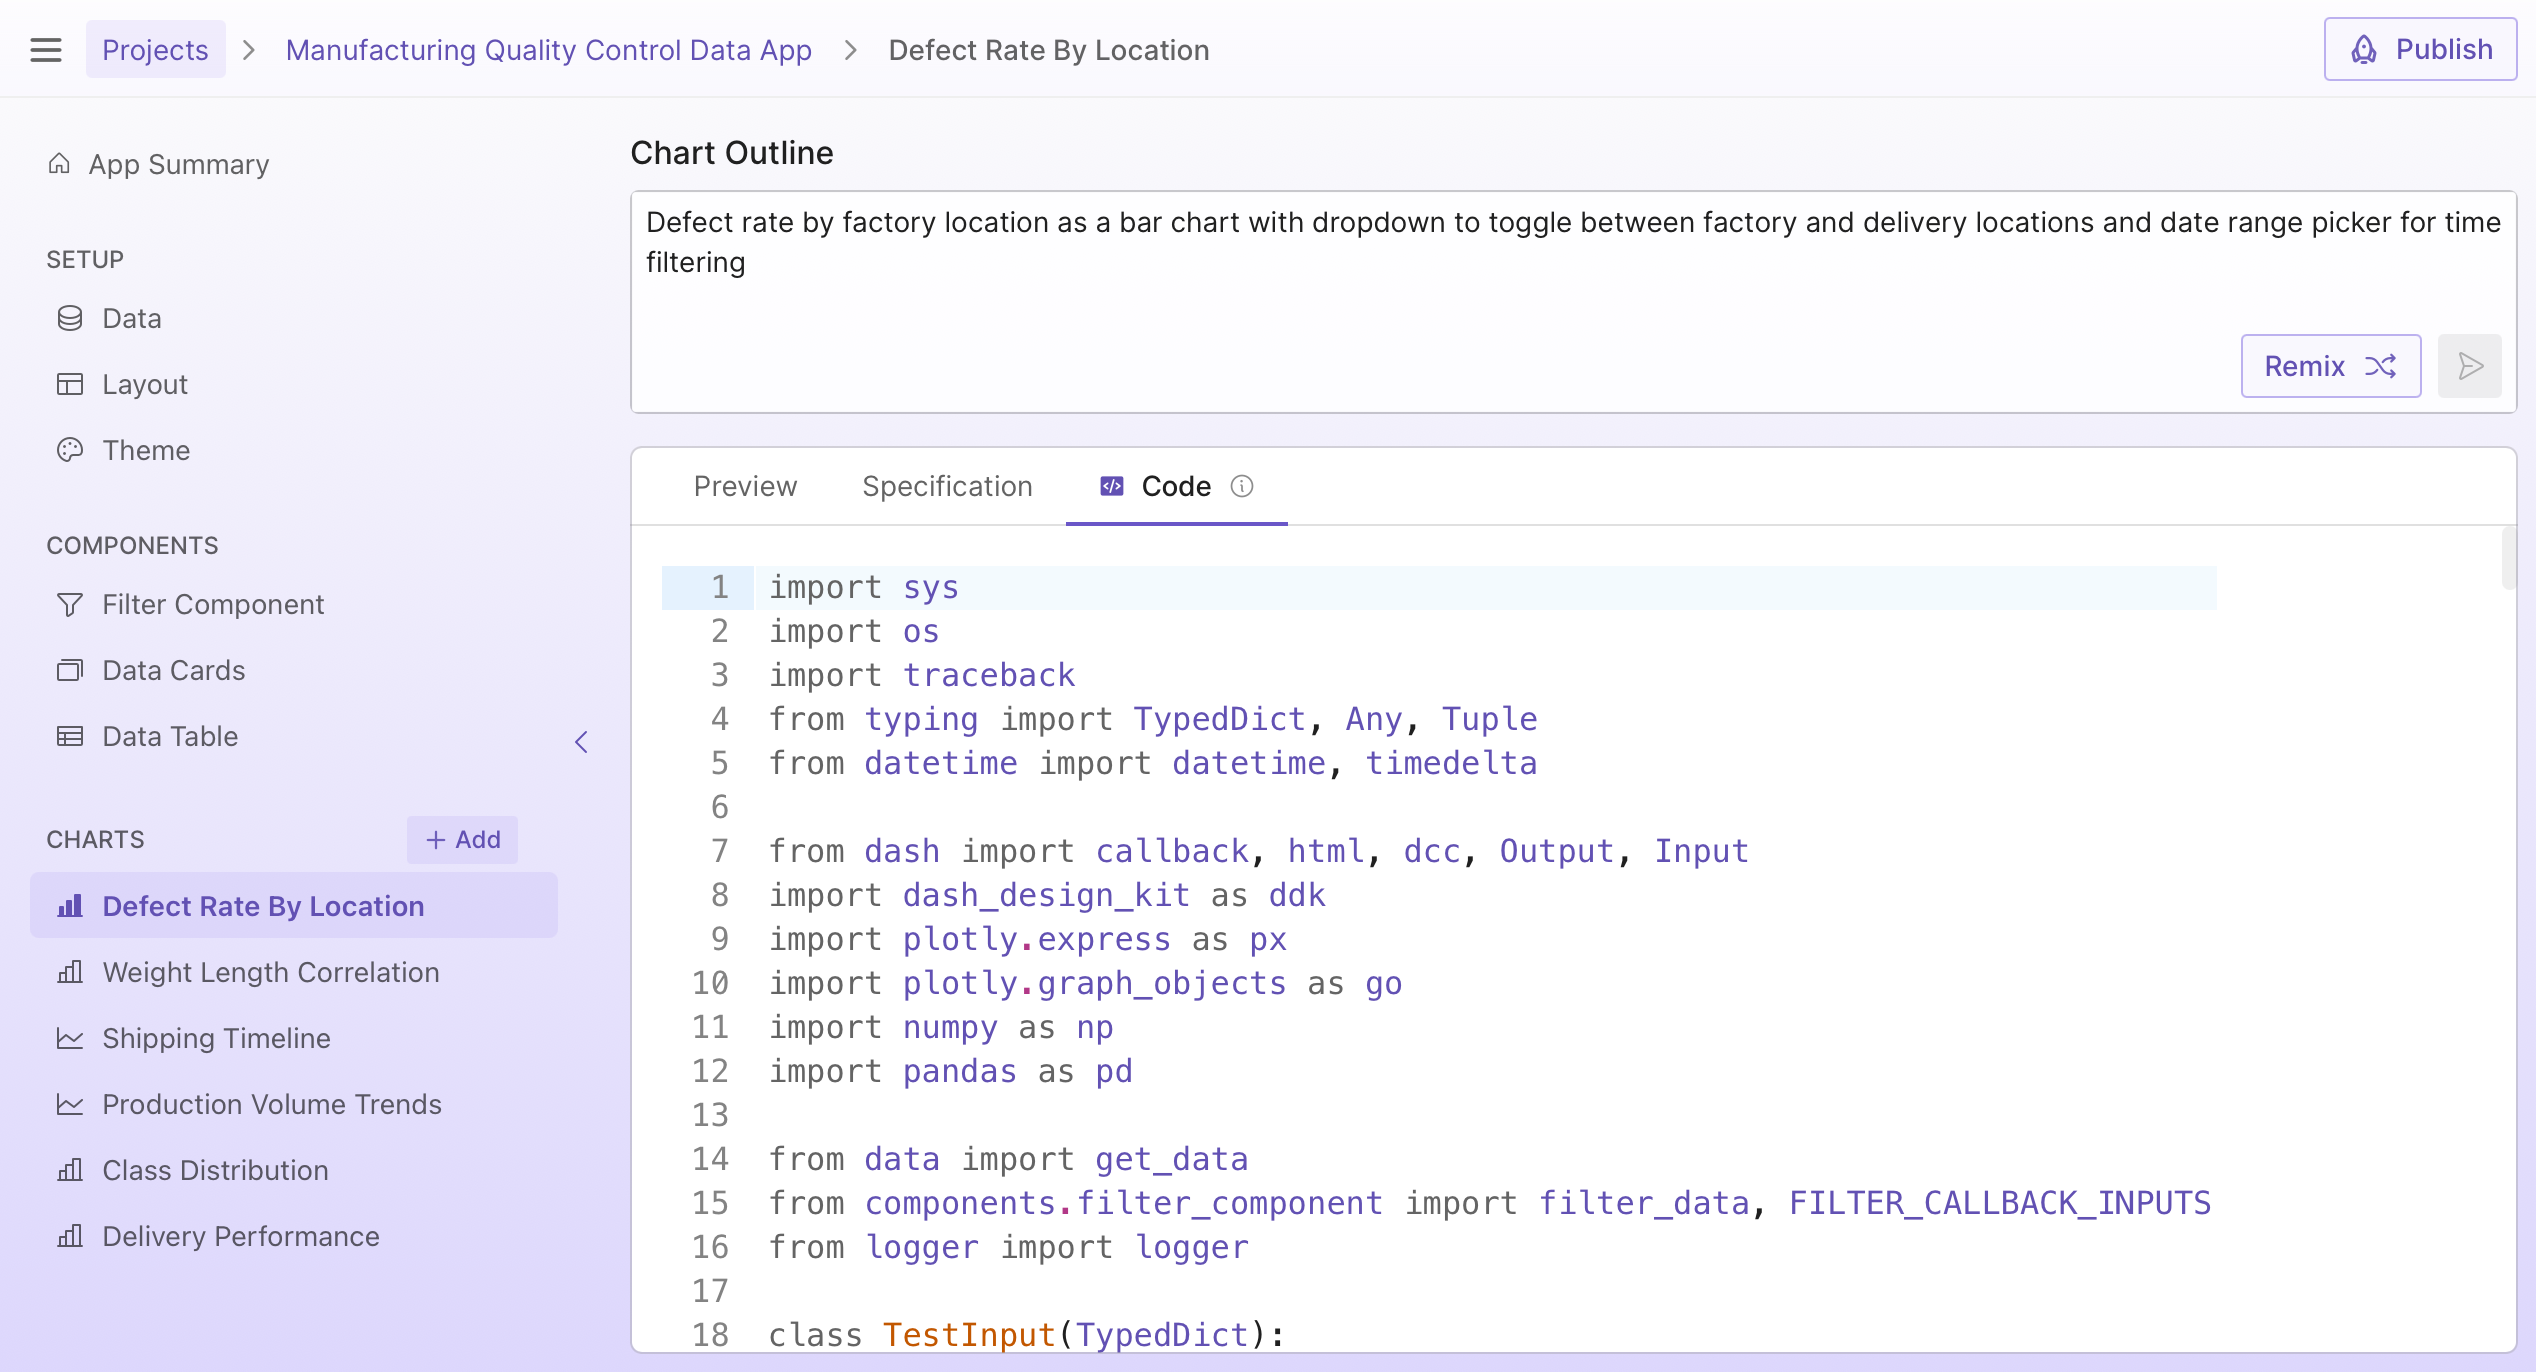
Select a component from the sidebar and you'll see:
- Prompt - A high-level description of the component. Edit and regenerate to update.
- Preview - See how this part of the app looks.
- Specification - AI-generated description of the code's behavior and details.
- Code - The Python code powering the component.
- Logs - Messages emitted from the code as it runs. New logs appear when you interact with the Preview.
Editing the prompt
The editable prompt is a high-level description of this specific part of the app. Updates to the prompt regenerate the app and update the preview. To update any part of your app, edit its prompt and select the regenerate button.
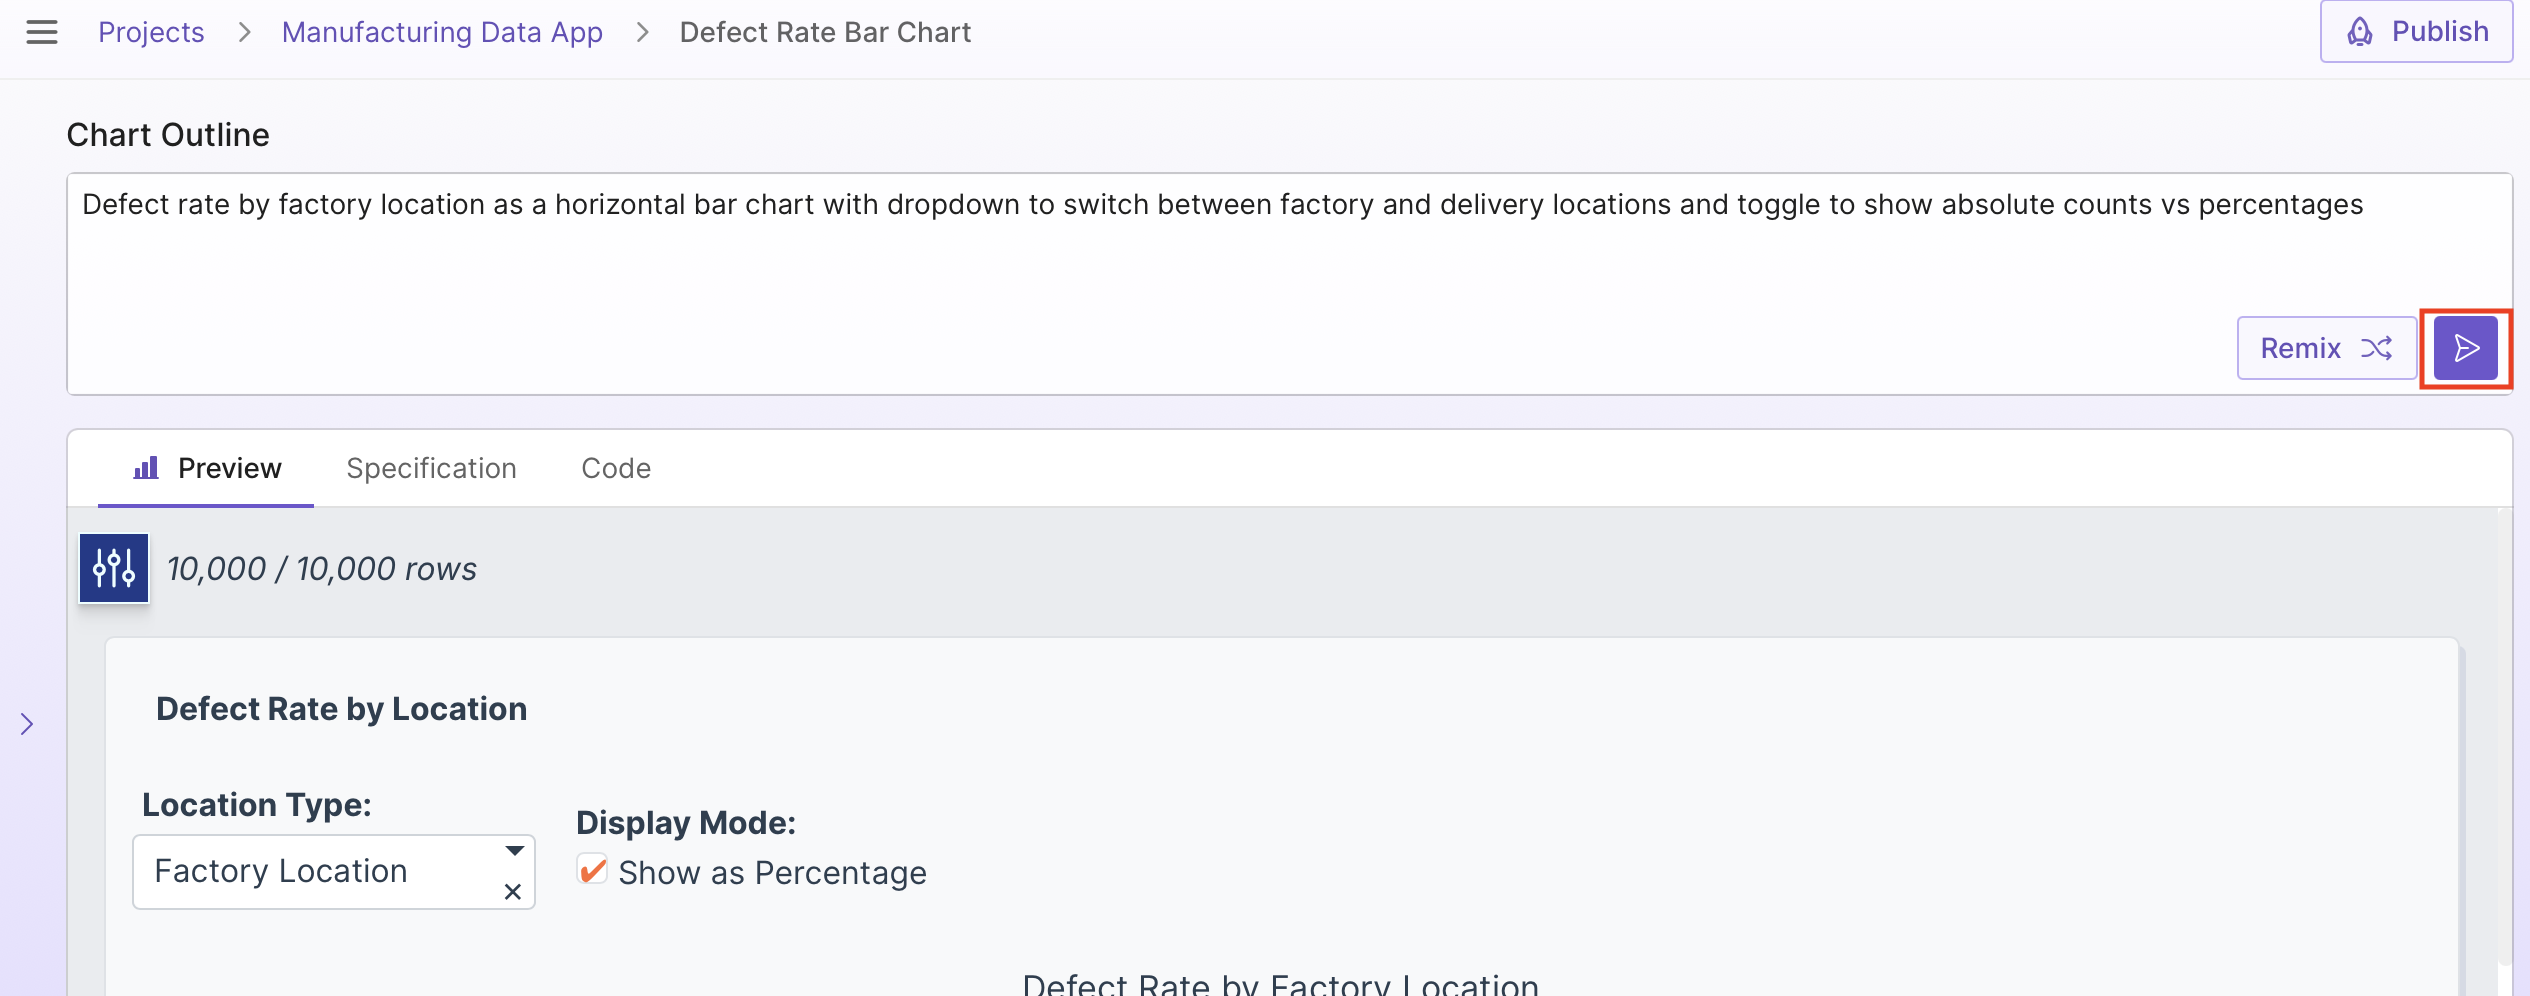
You can also generate a new version using the existing prompt with the Remix option:
Info
You won't see the Remix option if you have made changes to the text in the prompt box but haven't regenerated.
Regeneration using a new prompt or remixing with the existing prompt updates the preview, specification, and code.
Tip
When updating the prompt, you can copy parts of the specification into the prompt to retain specific details from the existing app.
Viewing and editing the code
The Code tab shows the Python code that powers your app. If your plan supports it, you can view and edit it in Plotly Studio.
See Working with Code for a complete guide.
Using the logs
The Logs tab shows how data was loaded, filtered, and transformed as you interact with the preview. Use it to debug issues - if your chart shows unexpected results, check the logs to see the data at each step. See Working with Code for more details.
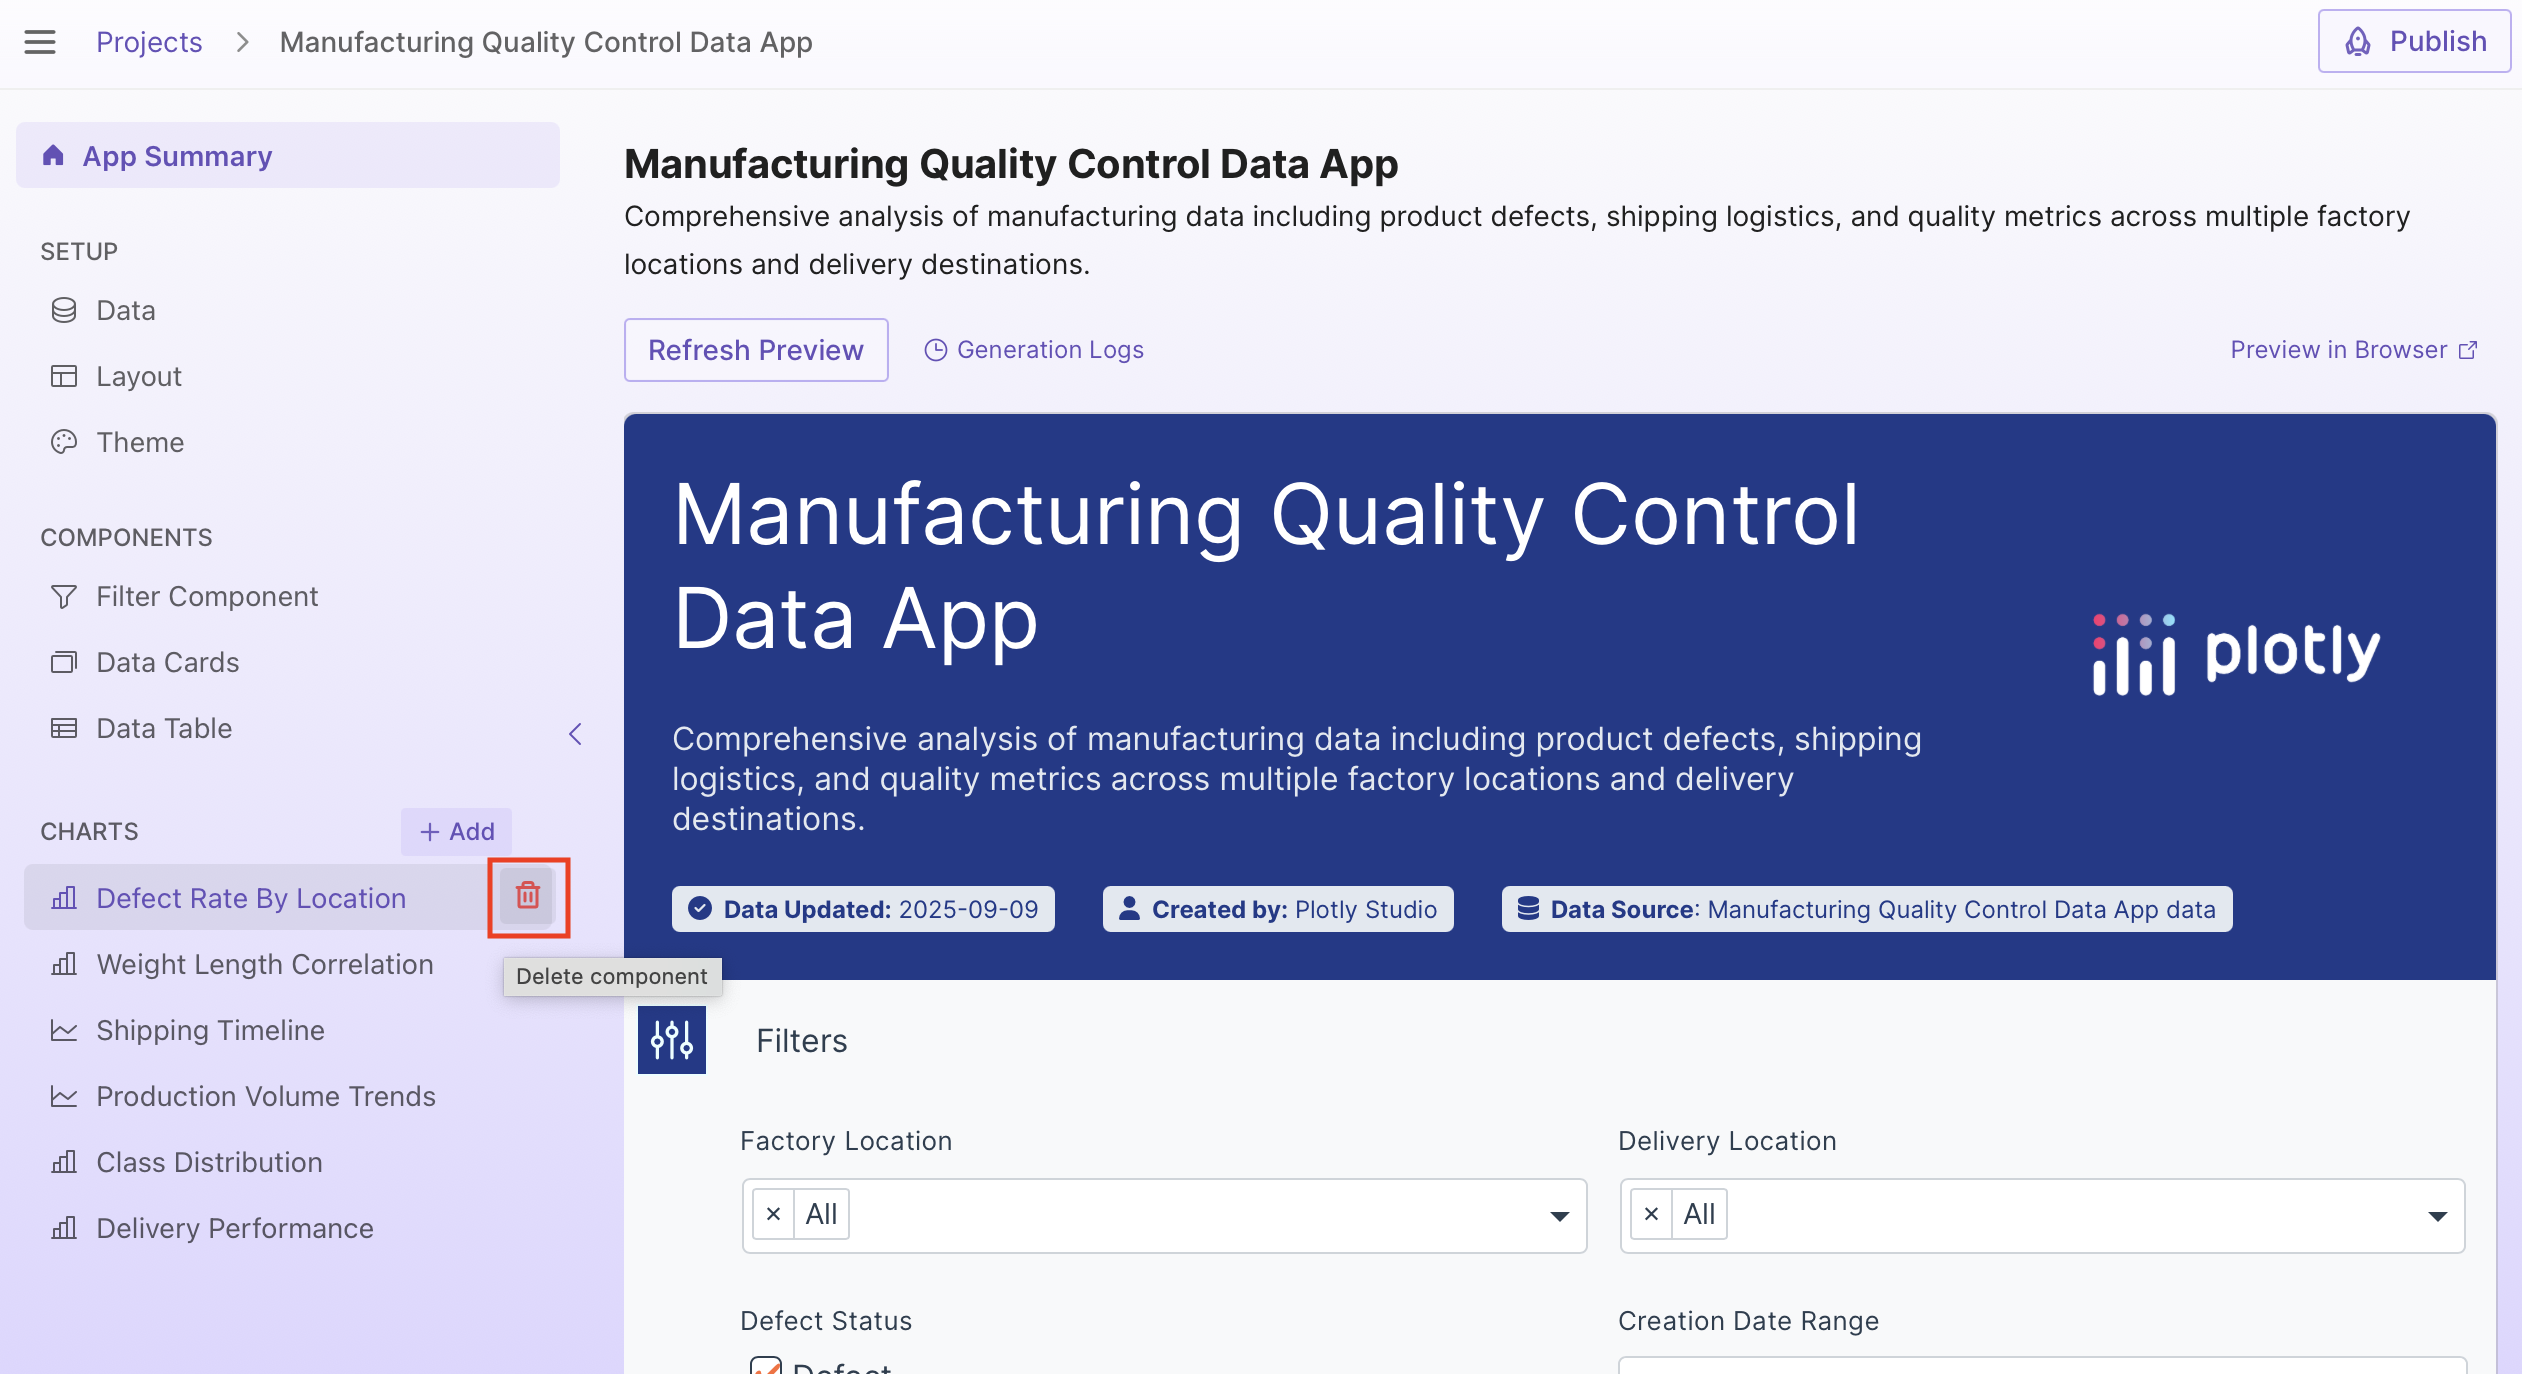
Removing components
To delete a component, hover over the component name in the sidebar and select its delete button. Data cards and charts can be deleted.
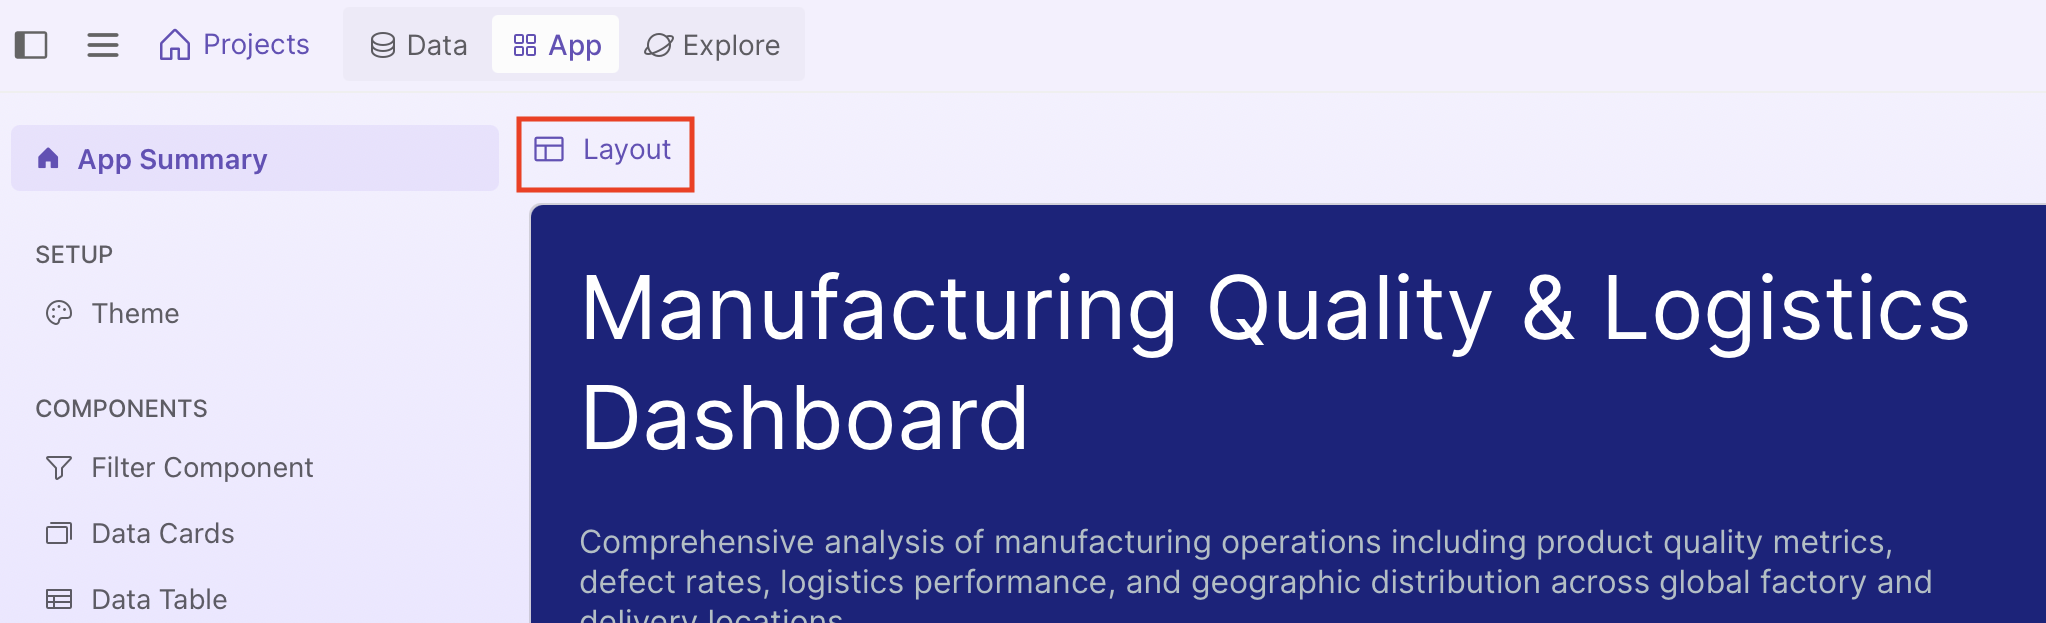
Editing the layout
You can customize how components are arranged using the layout editor. From the App Summary page, select Layout to open it.
In GUI mode, drag cards to rearrange them, drag the resize handle on the right edge to adjust a component's width, or hide components you don't want to display. You can also switch to Prompt mode to describe your app's layout using natural language.
See Layout Editor for a full guide to configuring your app's layout.
Editing the theme
Select Theme in the sidebar to customize your app's colors, fonts, and visual styling. Edit the prompt to describe your desired theme, then regenerate to apply changes.
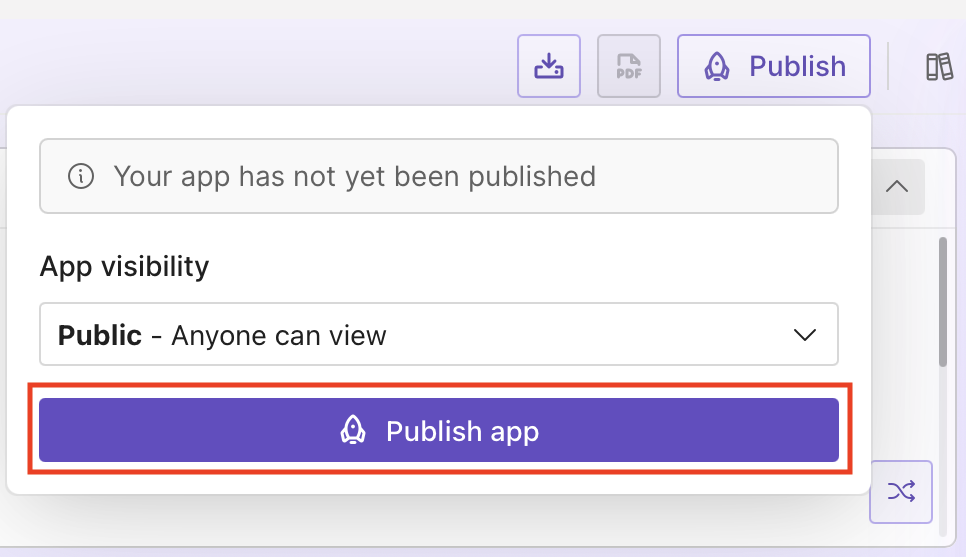
Publishing
Once you are happy with your app, you can publish it to Plotly Cloud or Dash Enterprise by selecting Publish and then Publish app. If publishing to Plotly Cloud, you can also choose your app's visibility before publishing. For Dash Enterprise, see App Privacy.
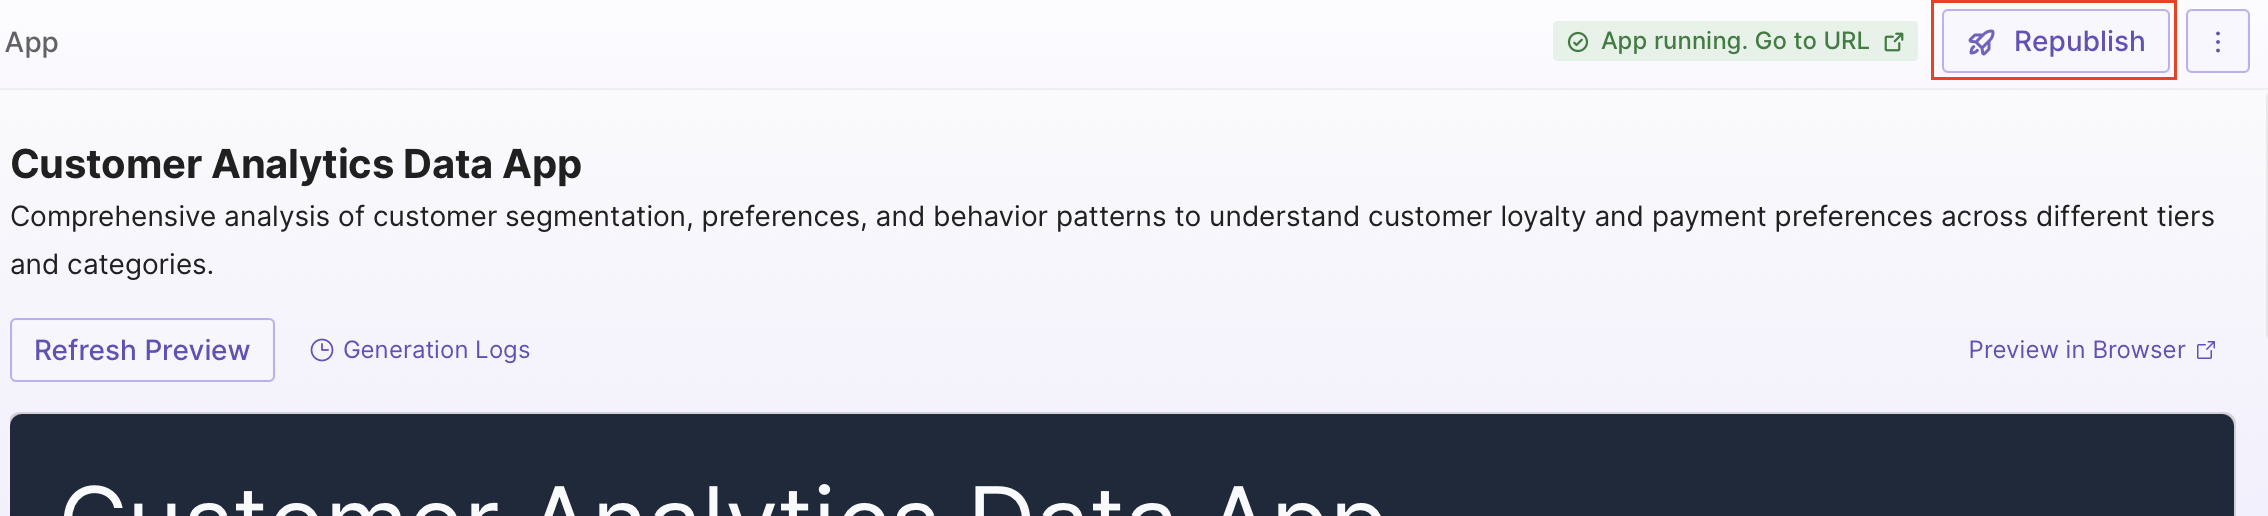
Select Publish and then View published app to go to the app:
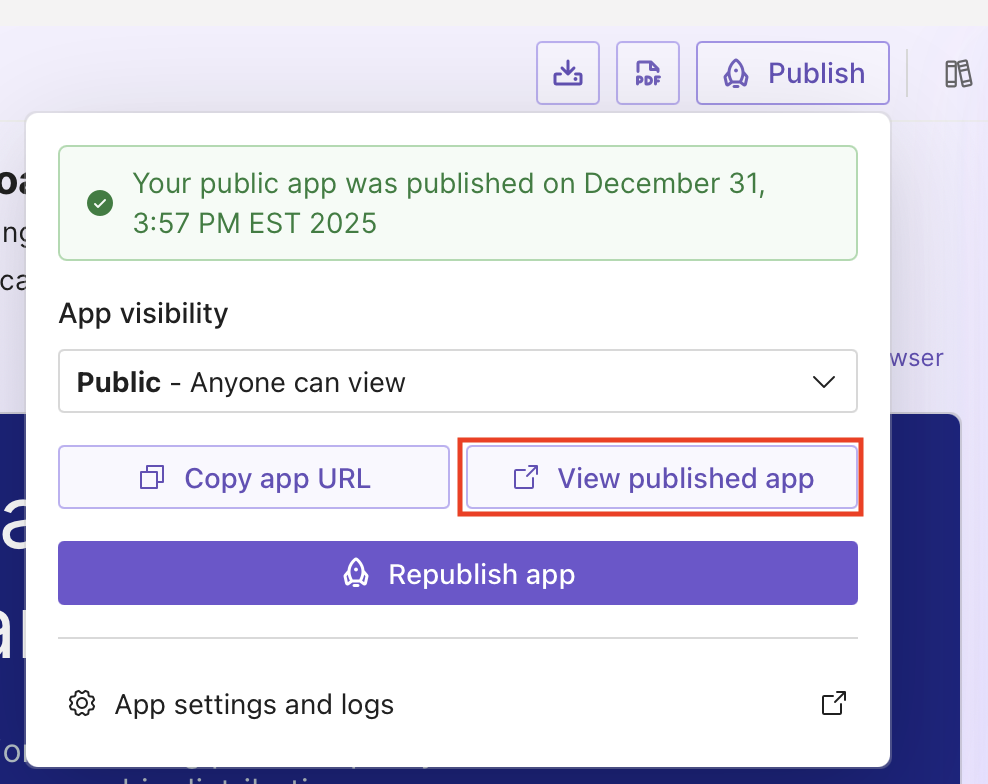
To update your live app, select Republish app from the Publish menu: