Setup, Components, and Charts
When you generate an app in Plotly Studio, it creates setup modules, components, and charts. Each of these can be updated by editing a prompt or code. You can add new charts from scratch, from chart suggestions, or from an image. You can also delete components and charts, and restore previous versions.
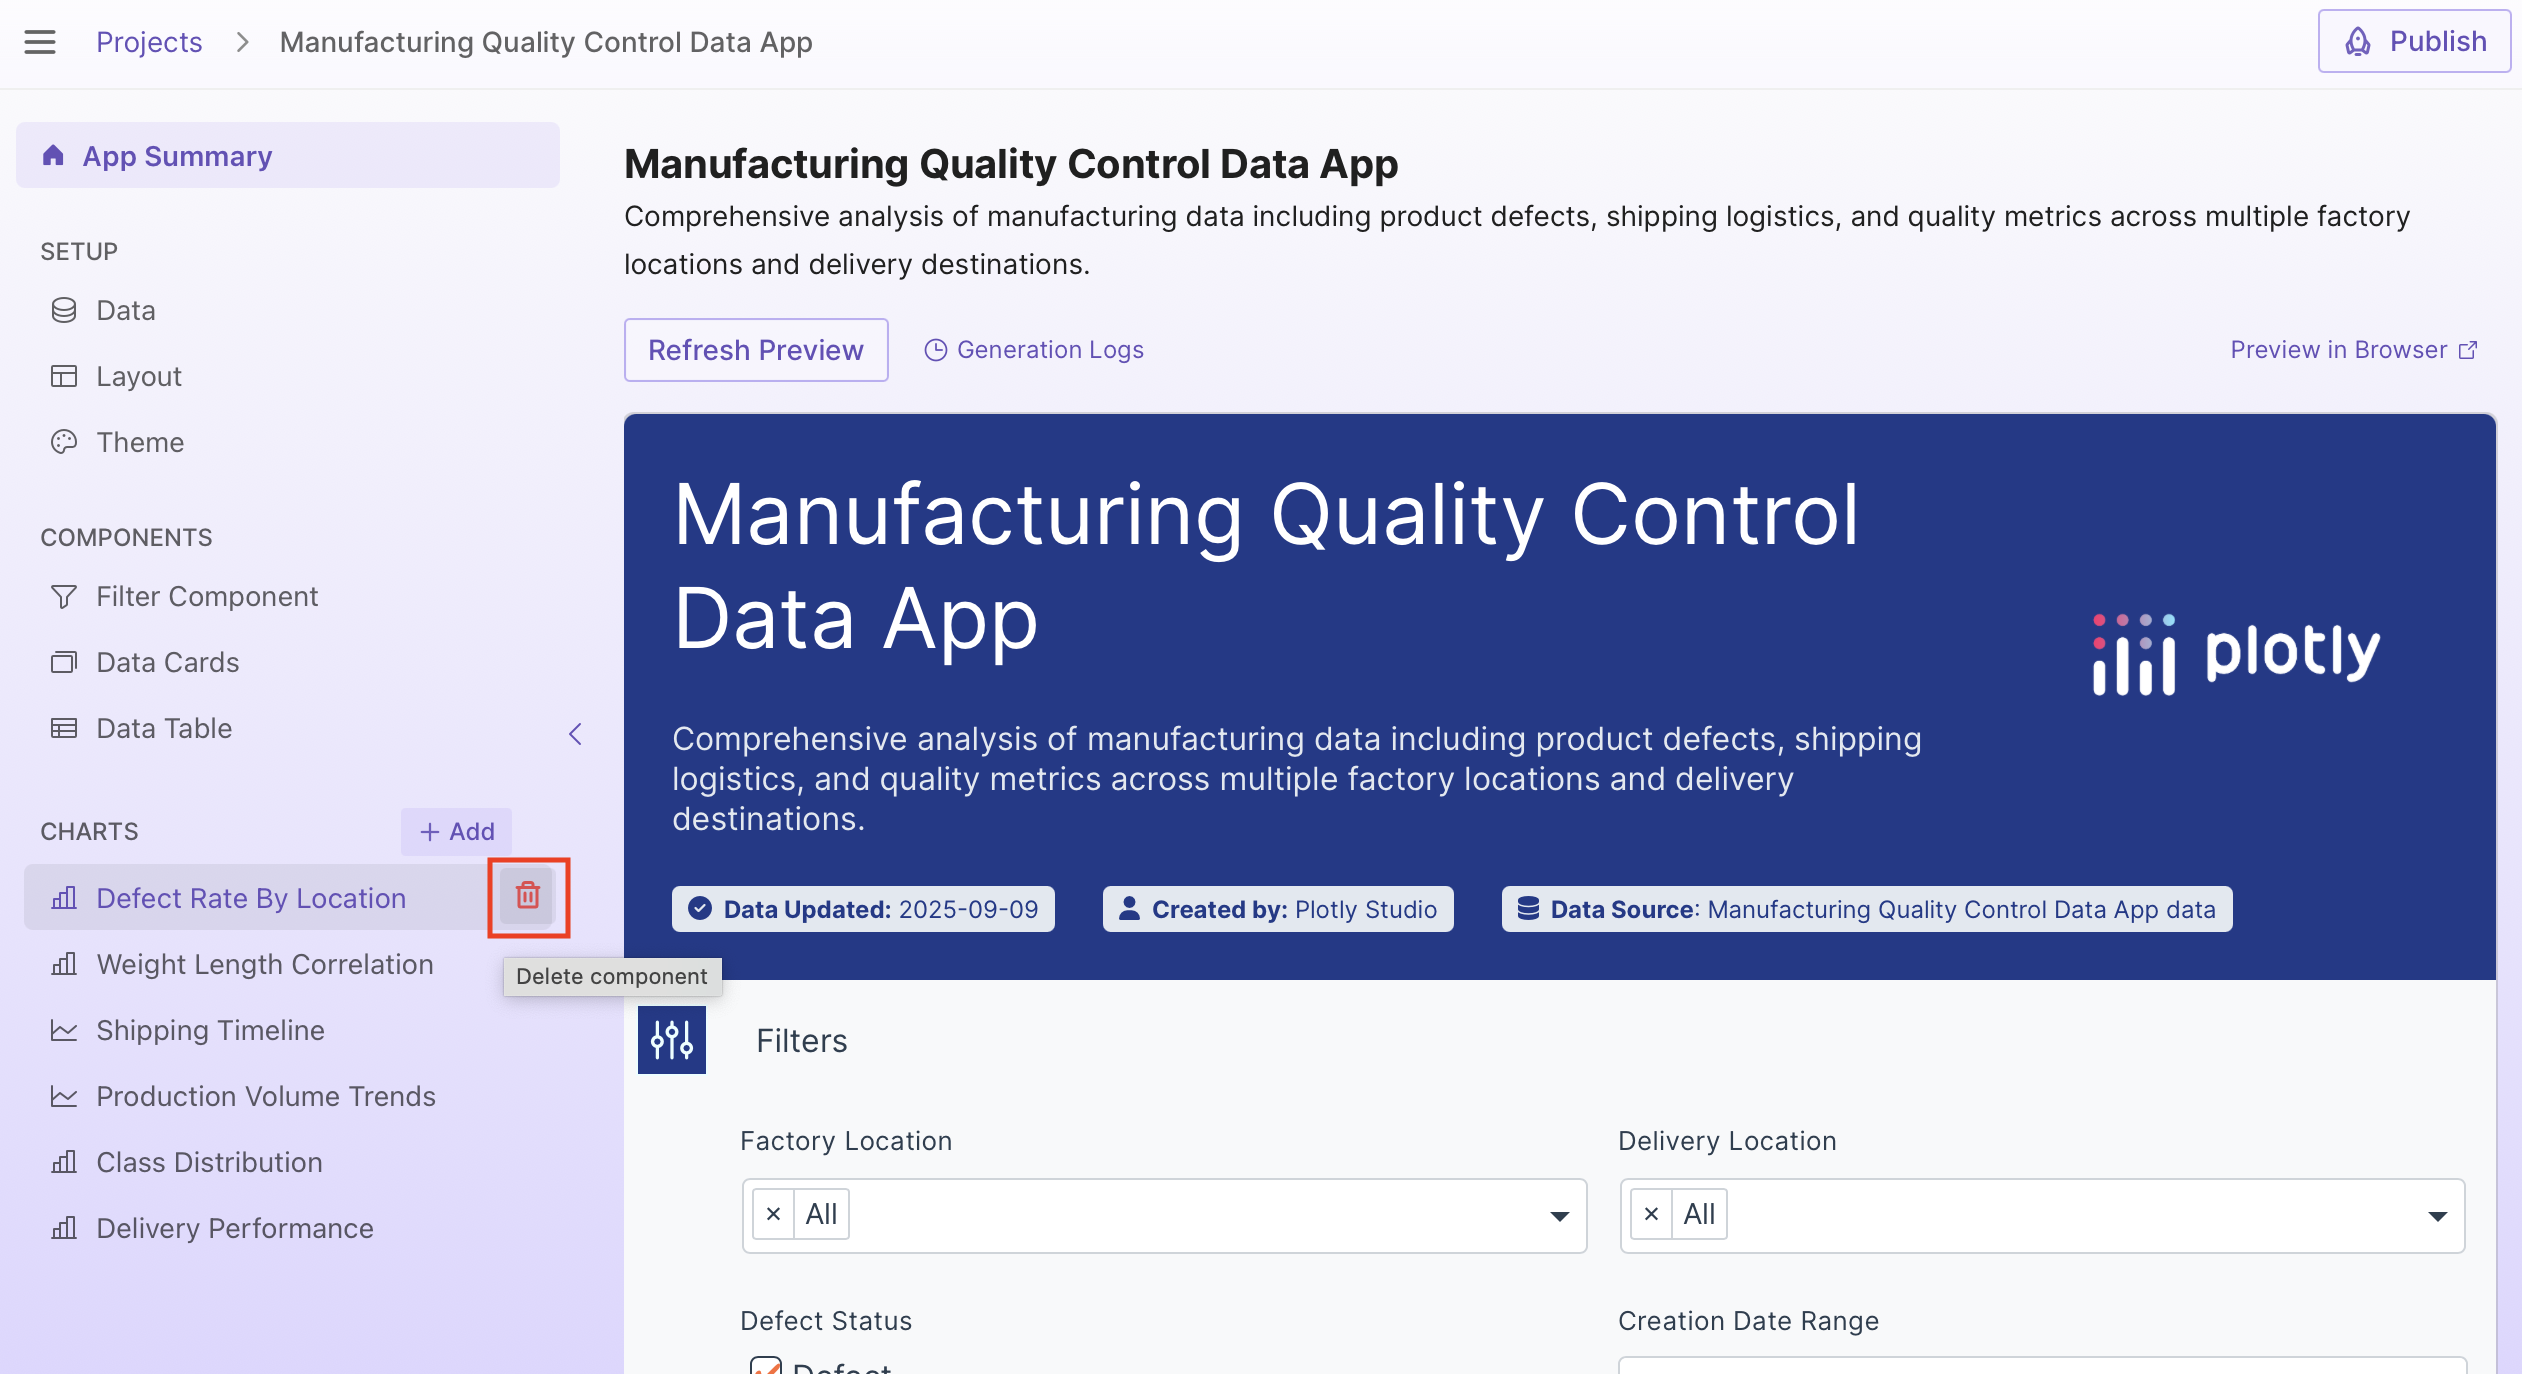
The sidebar in the App tab shows the setup modules, components, and charts:
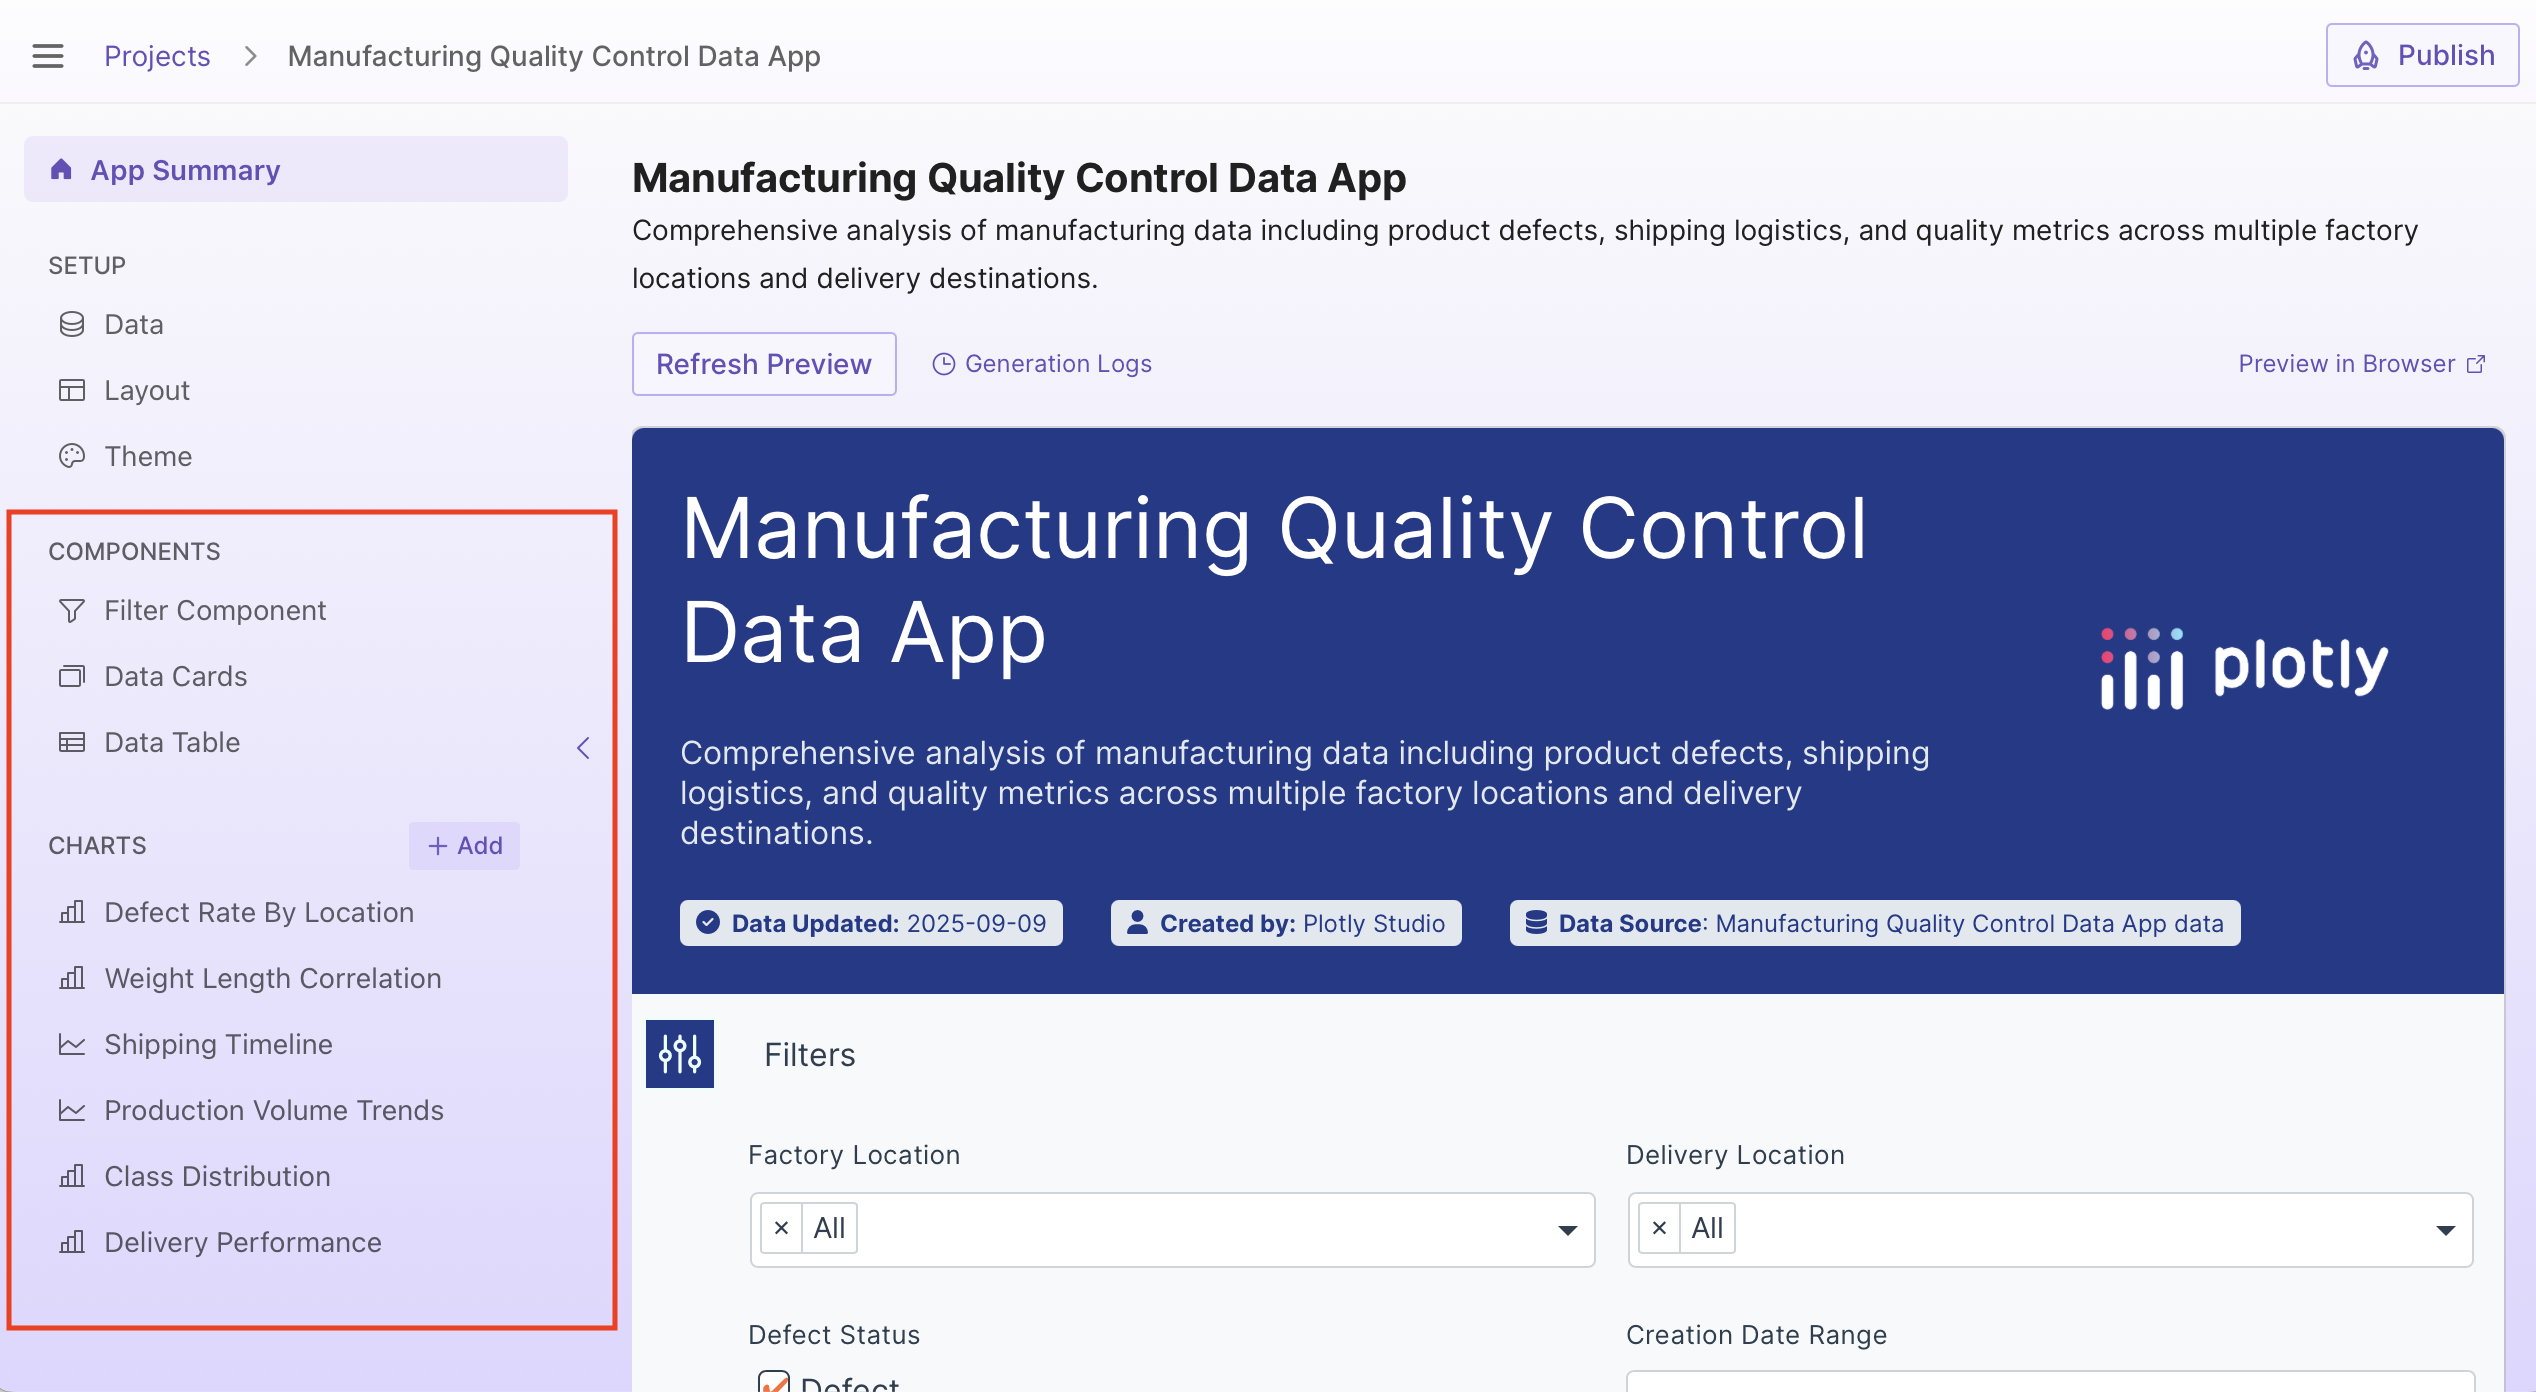
- Theme - How the app is styled, and what colors and typography it uses.
- Filter Component - Global filters that filter data used in other components, the data cards, and charts.
- Data Cards - Summary statistics and key metrics.
- Charts - Visualizations of the data.
Editing components
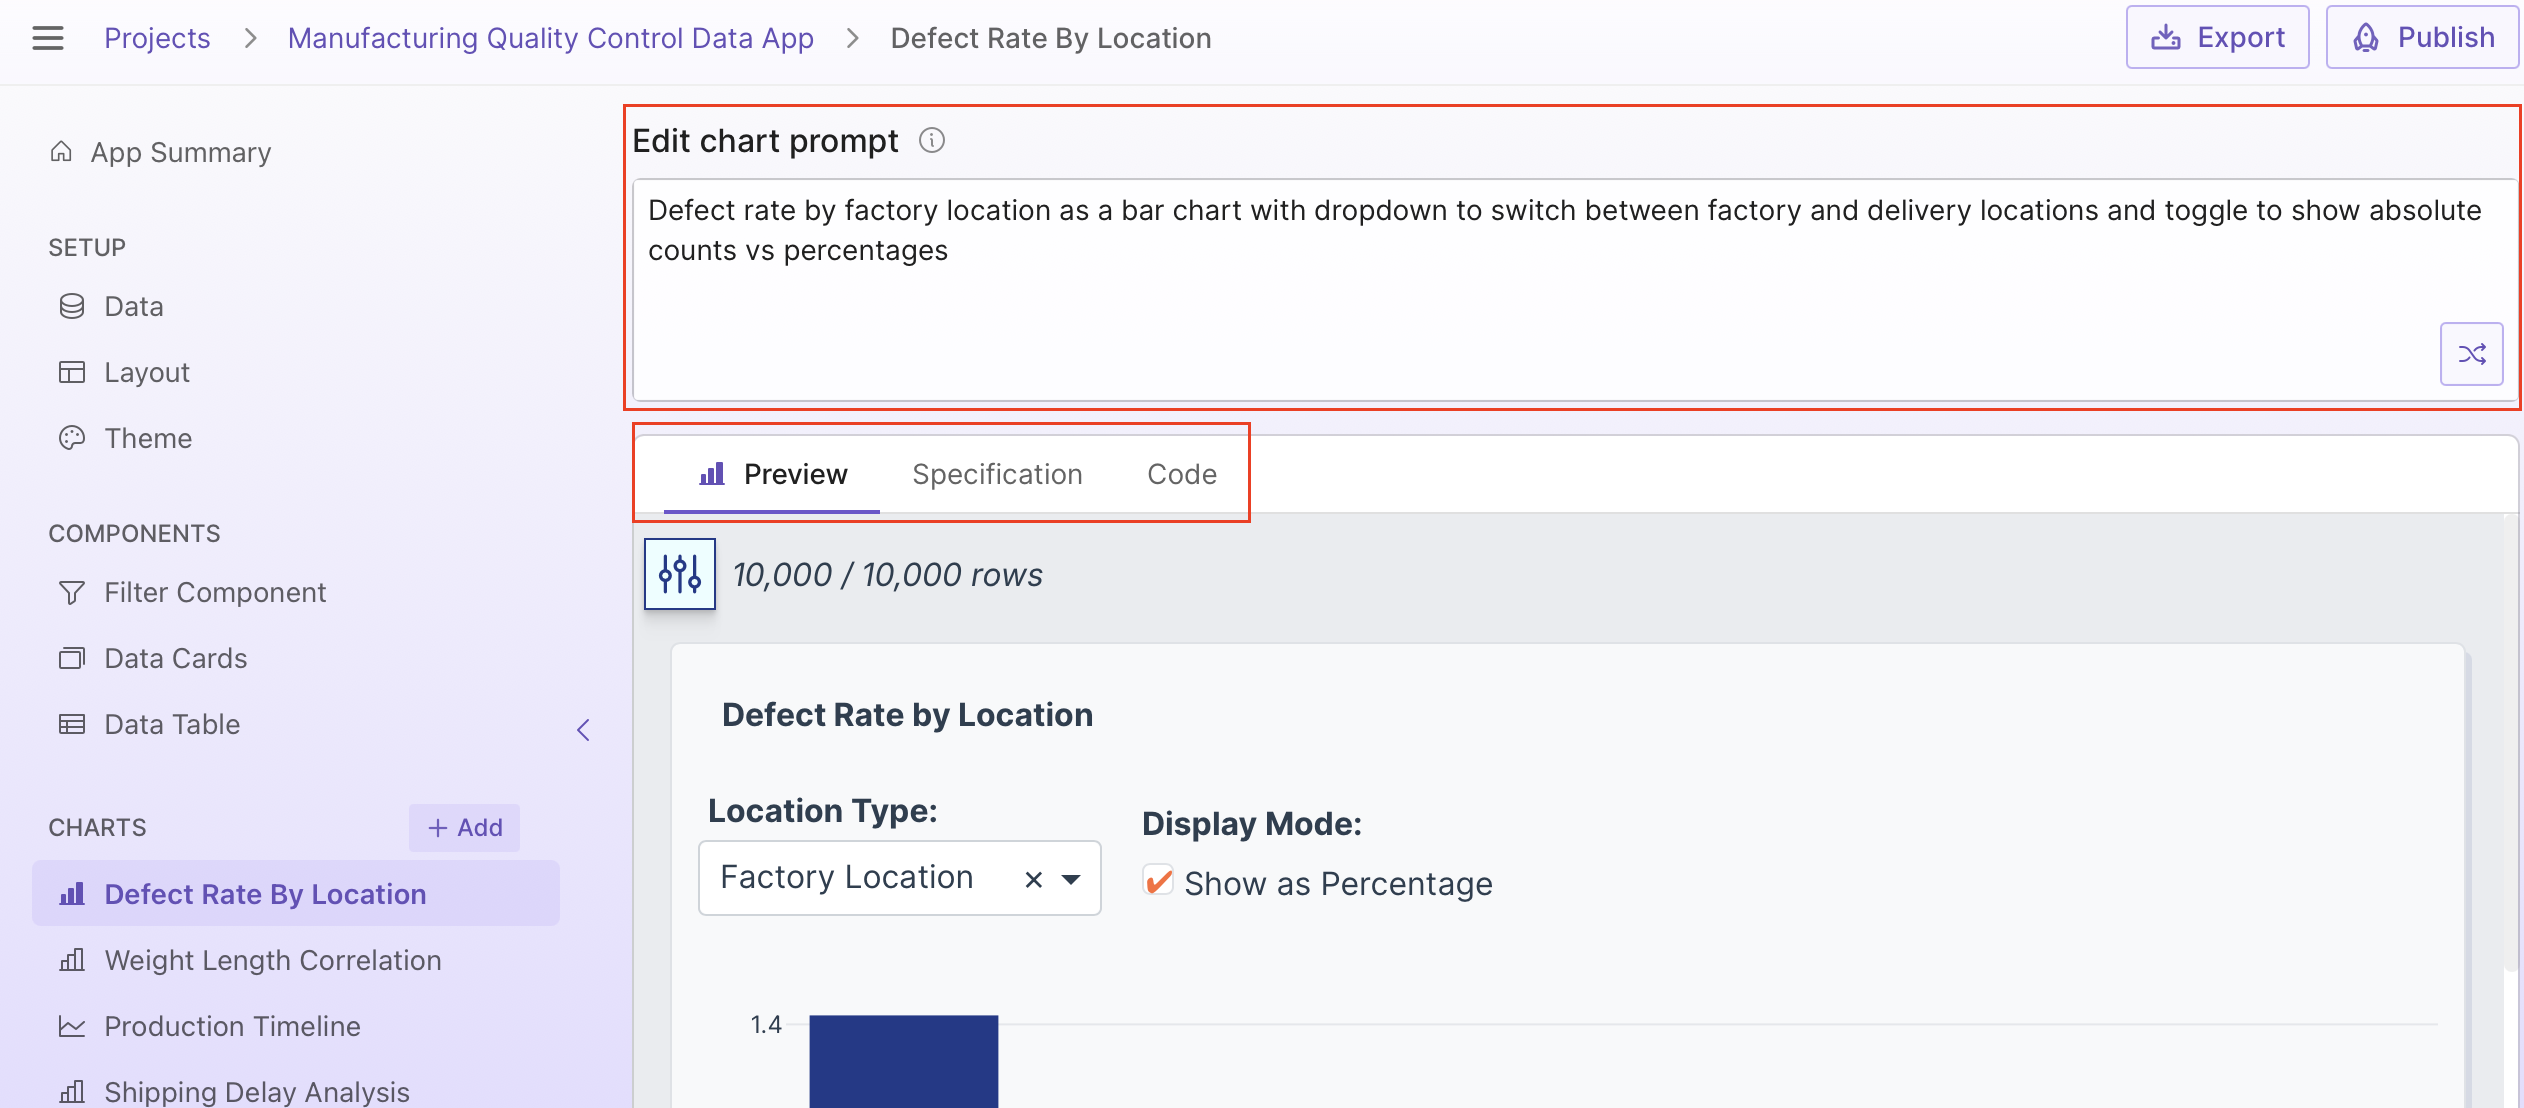
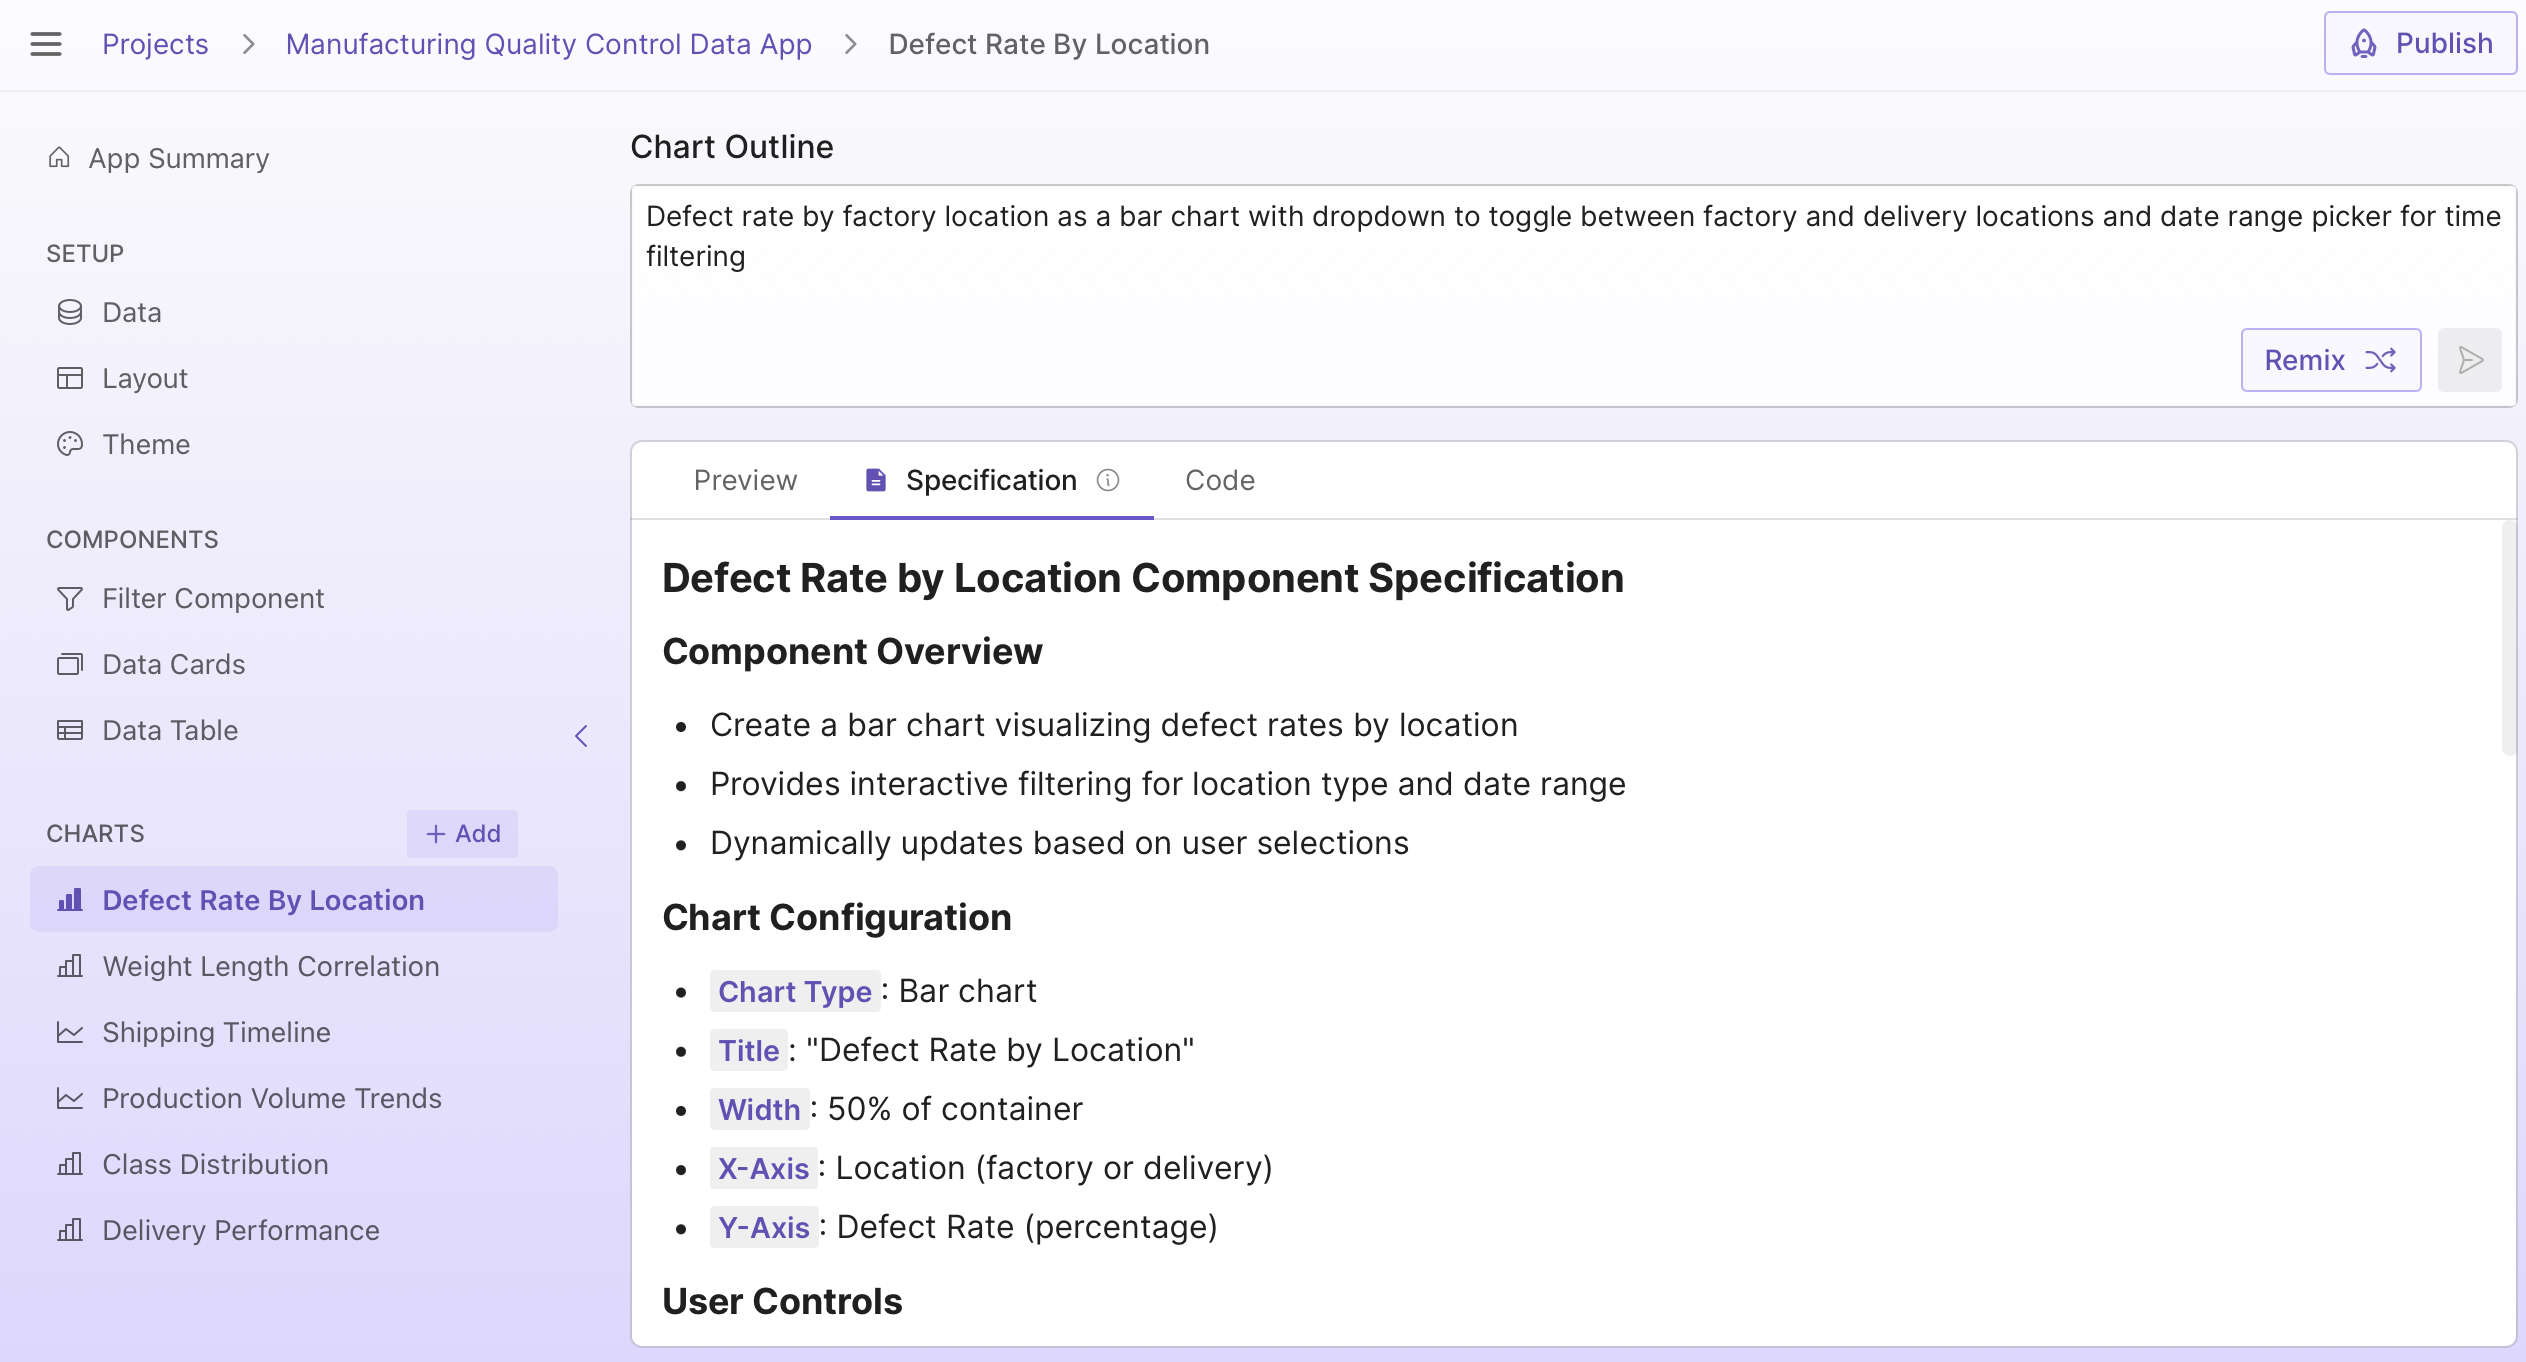
Select a component from the sidebar and you'll see an editable prompt, a preview, a specification, code, and logs:
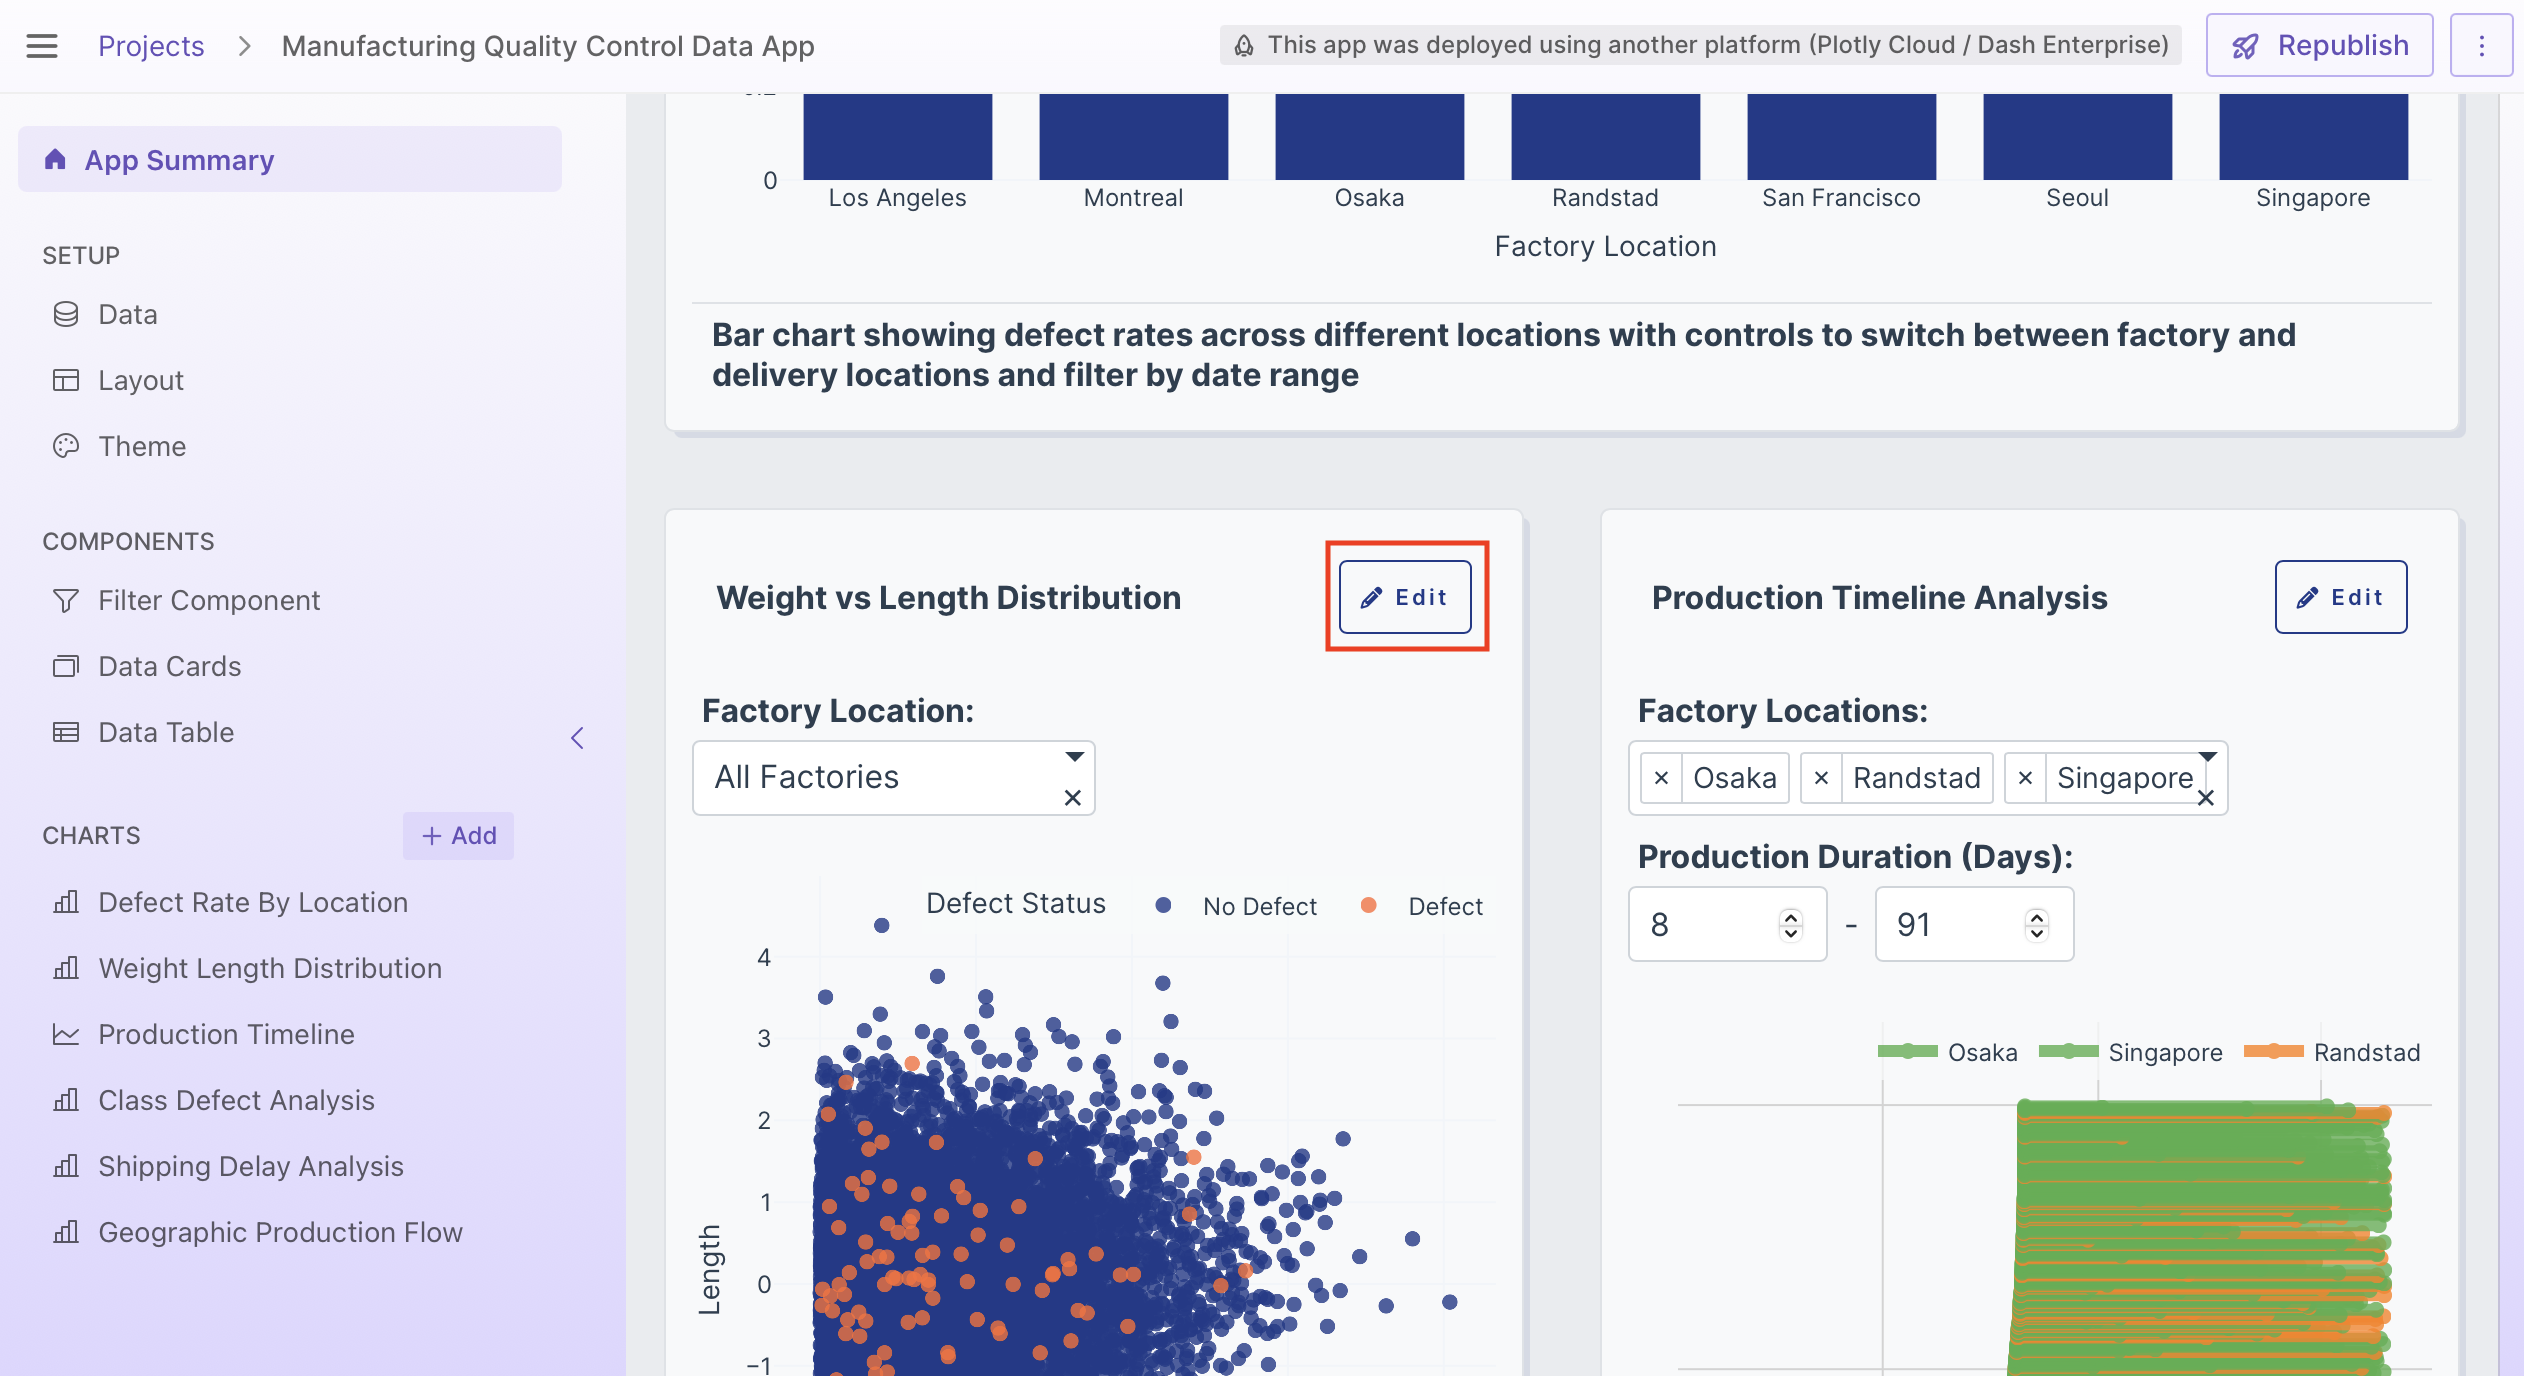
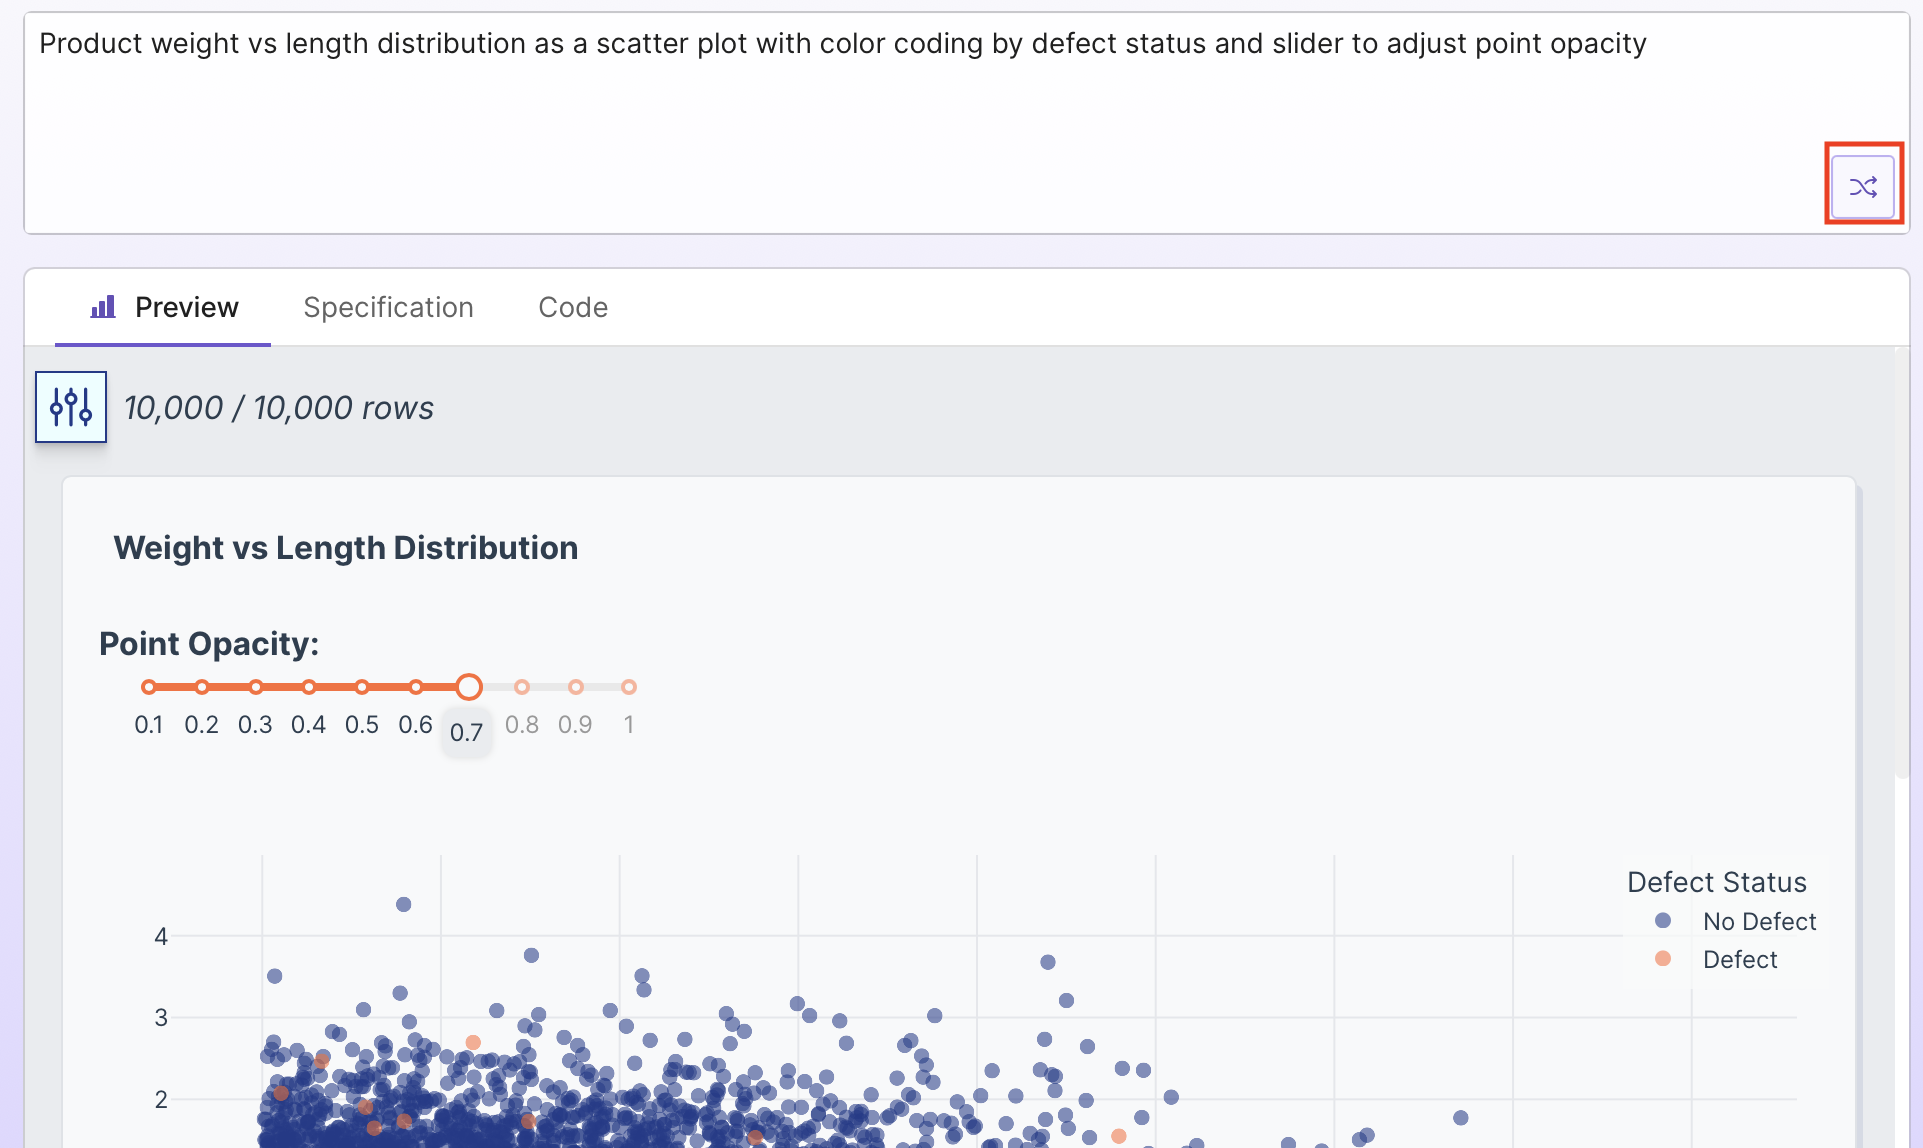
You can also open a component from the app preview on the App Summary page:
Editable Prompt
The editable prompt is a high-level description of this specific part of the app. Updates to the prompt regenerate the app and update the preview.
Preview
This is a preview of this specific part of the app. Note: A preview is not available for the Layout.
Specification
The specification is a natural language description of the Python code. When updating the prompt, you can copy parts of the specification into the prompt if there are parts of the existing app that you want to retain.
Code
Editable Python code that uses Dash and other Plotly libraries. This code runs in the preview and is also used in the deployed app. It updates when you make prompt updates.
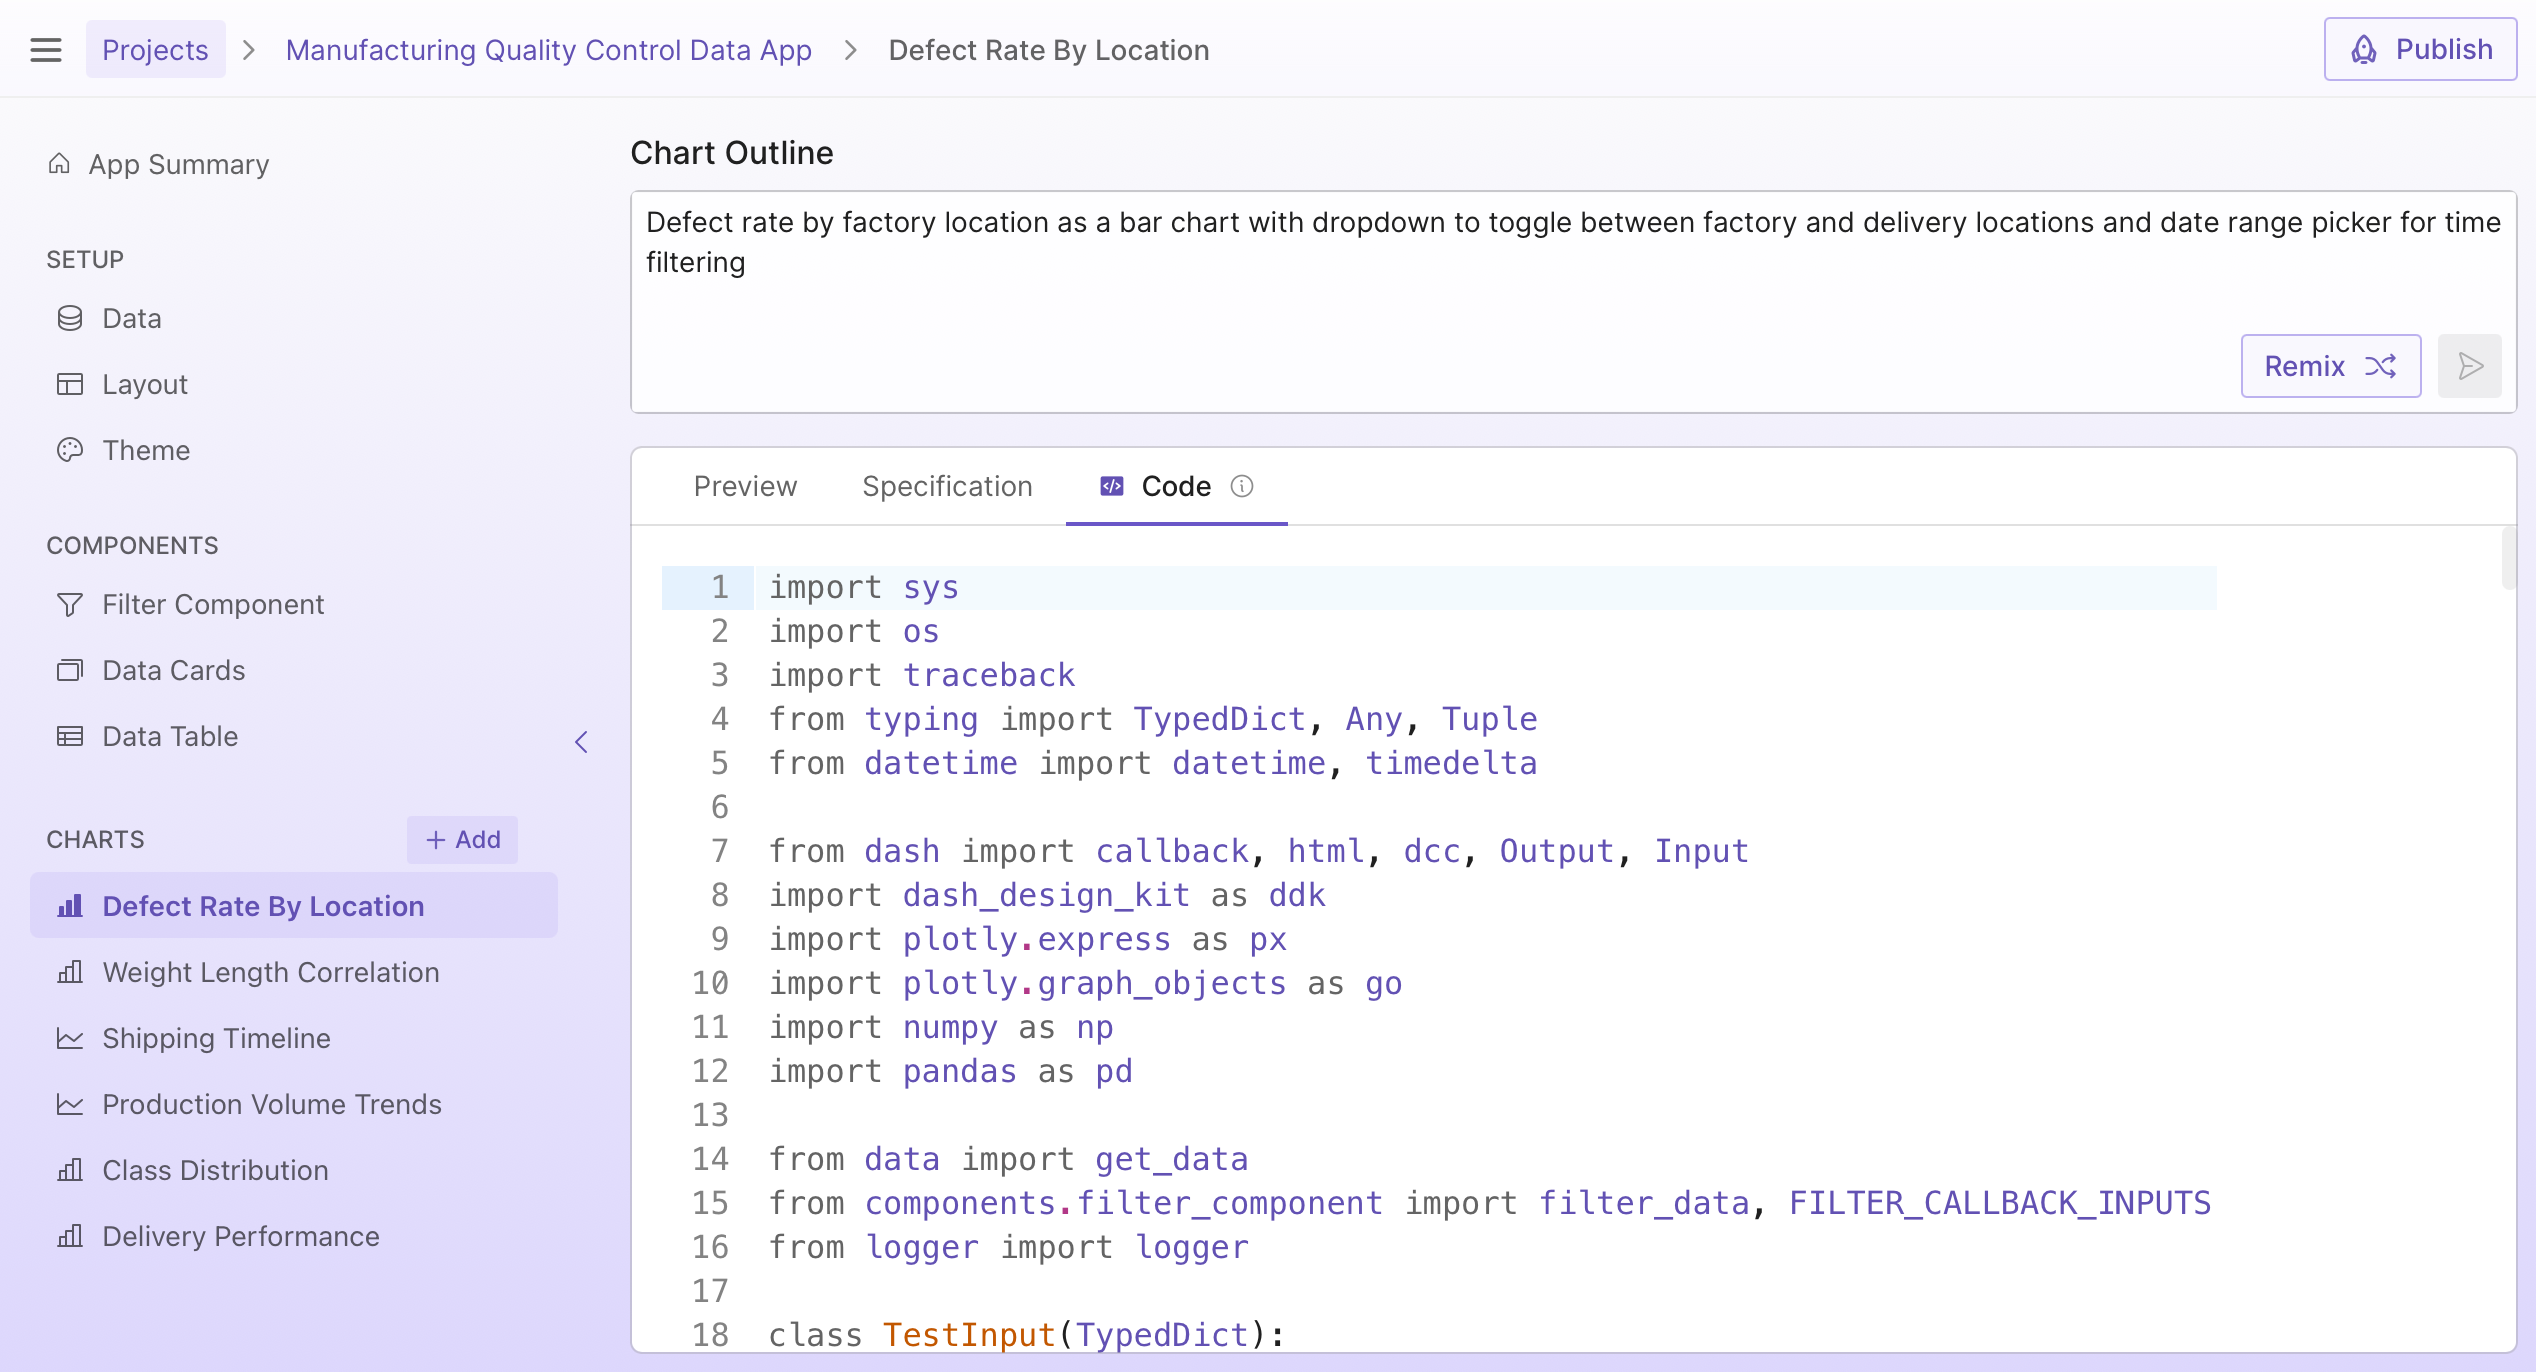
See Working with Code for a complete guide to how Plotly Studio generates code and how to make updates.
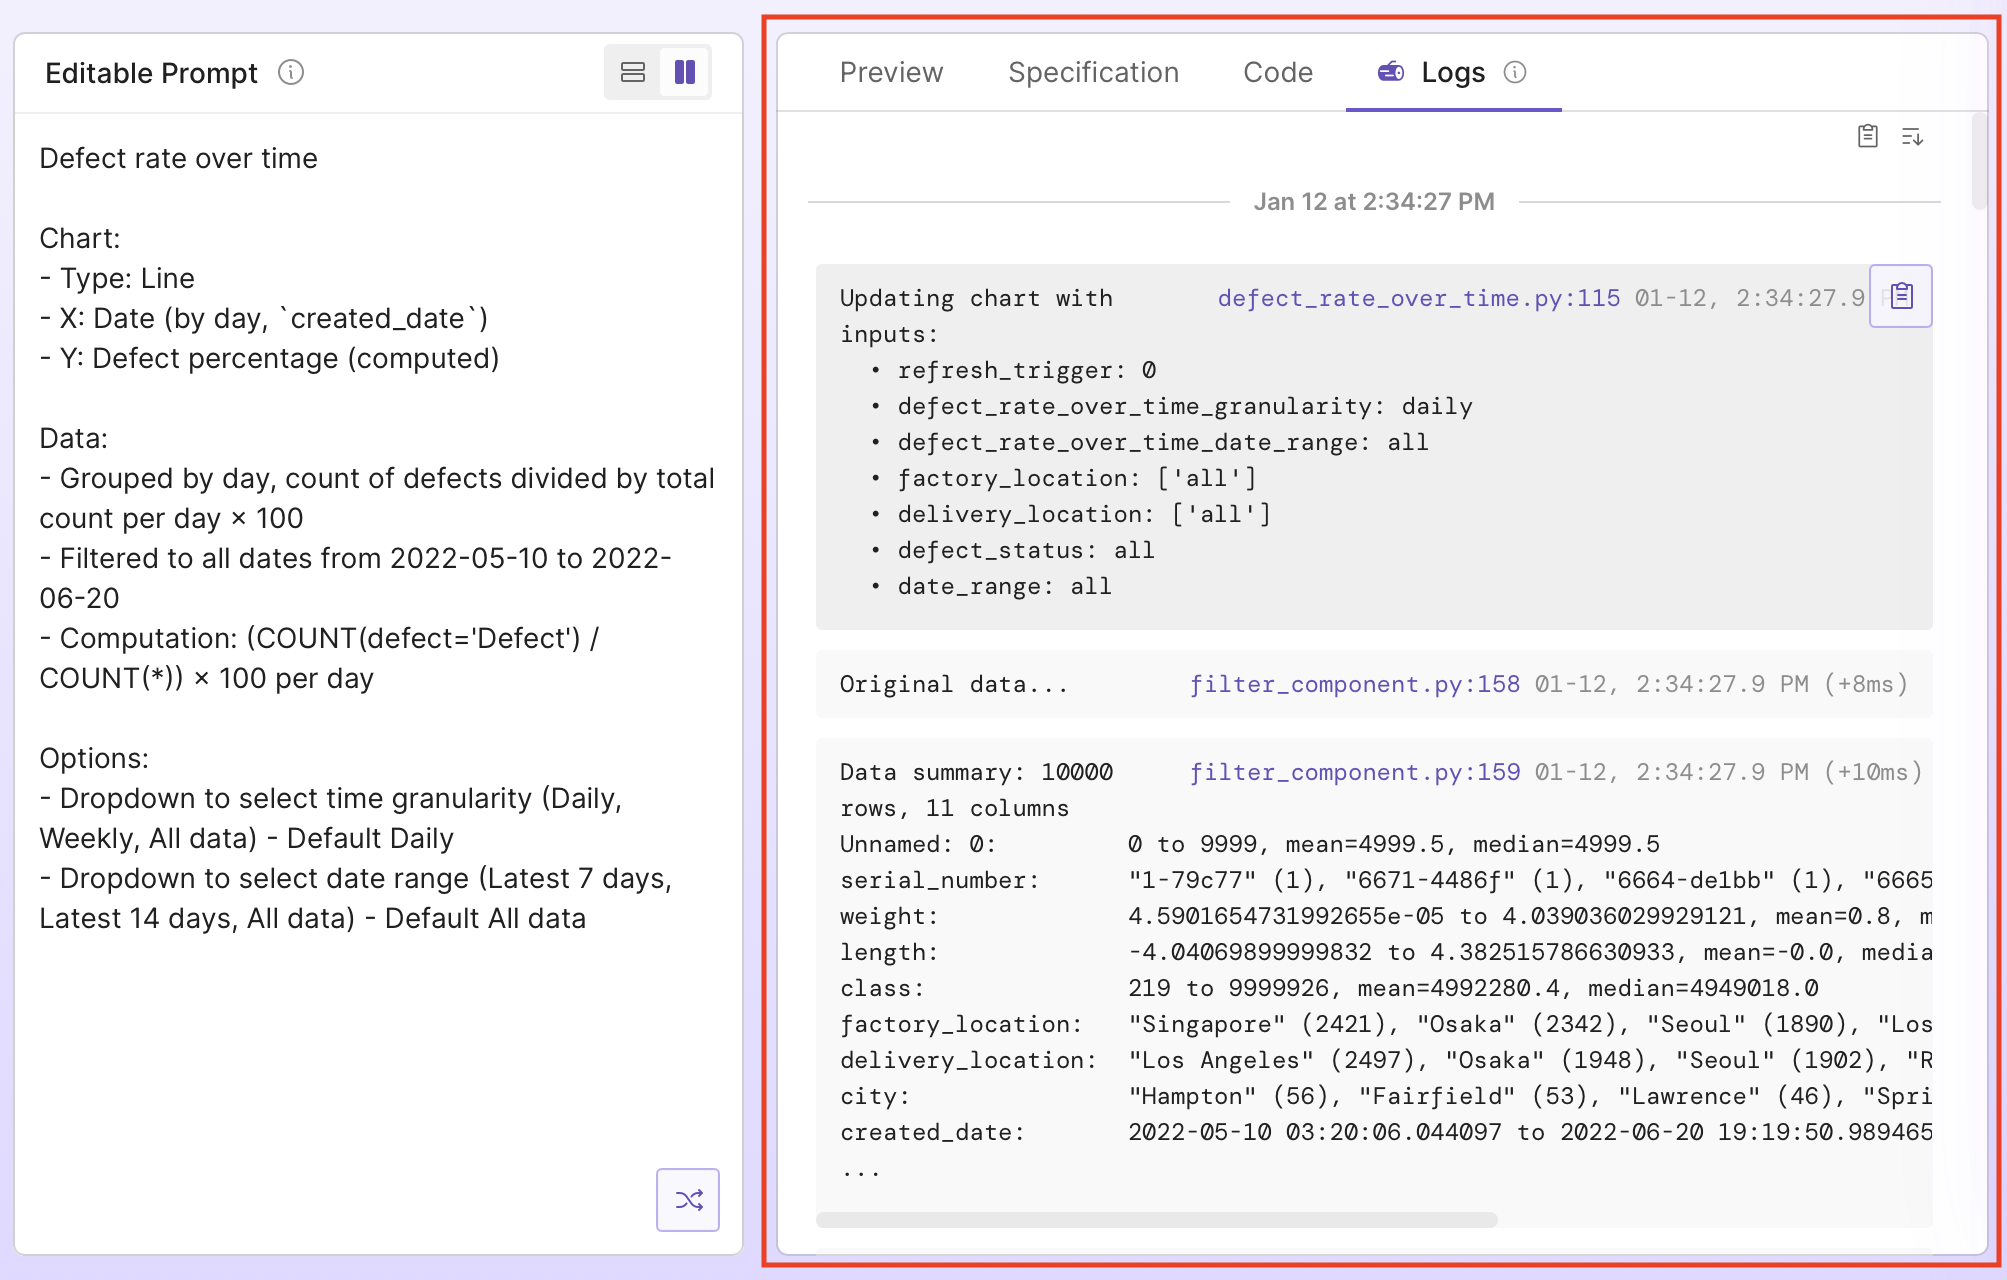
Logs
Logs are messages emitted from the code as it runs. The Logs tab shows new logs when you view and interact with the preview, showing how data was loaded, filtered, and transformed before rendering the output. For example, if you go to the preview tab and change multiple dropdowns that filter a chart, the logs update to show the new input values, the output of each filter step, and the final filtered data.
As well as data previews for each step, logs include timing information and any errors that occurred. This can help you understand what the code is doing, spot-check data transformations, and debug issues. For example, if your chart shows unexpected results, check the logs to see the row count and data preview after each step to identify where the issue occurred. See Working with Code for more details.
Editing the prompt
To update any part of your app, edit its prompt and select Regenerate.
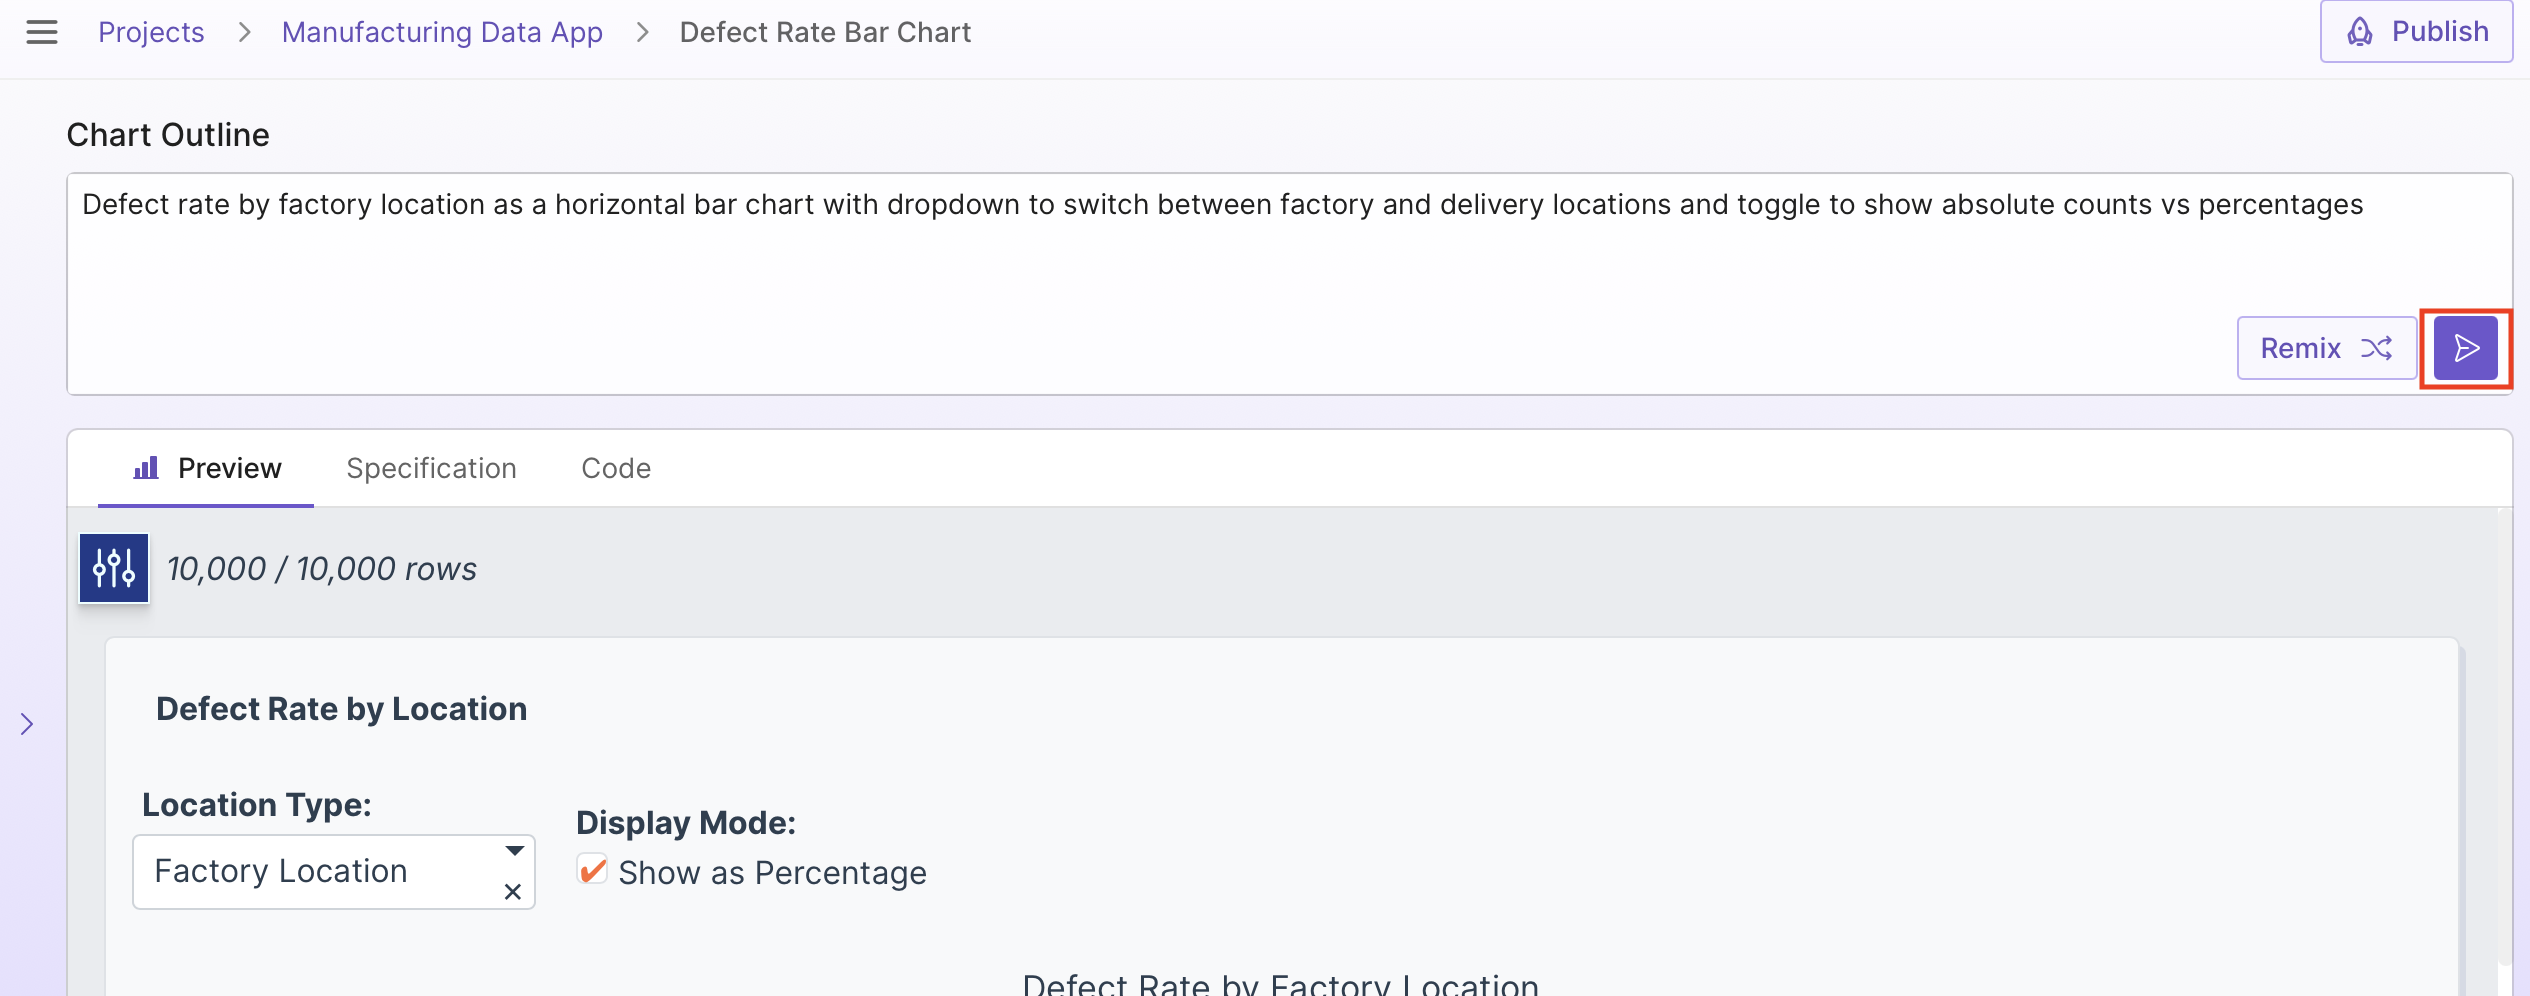
You can also generate a new version using the existing prompt with Remix.
Info
You won't see the Remix option if you have unsaved changes in the prompt box.
Regeneration using a new prompt or remixing with the existing prompt updates the preview, specification, and code.
See Understanding Prompts for more on how prompts work.
Removing components
To delete a component, hover over the component name in the sidebar and select its delete button. Only data cards and charts can be deleted.
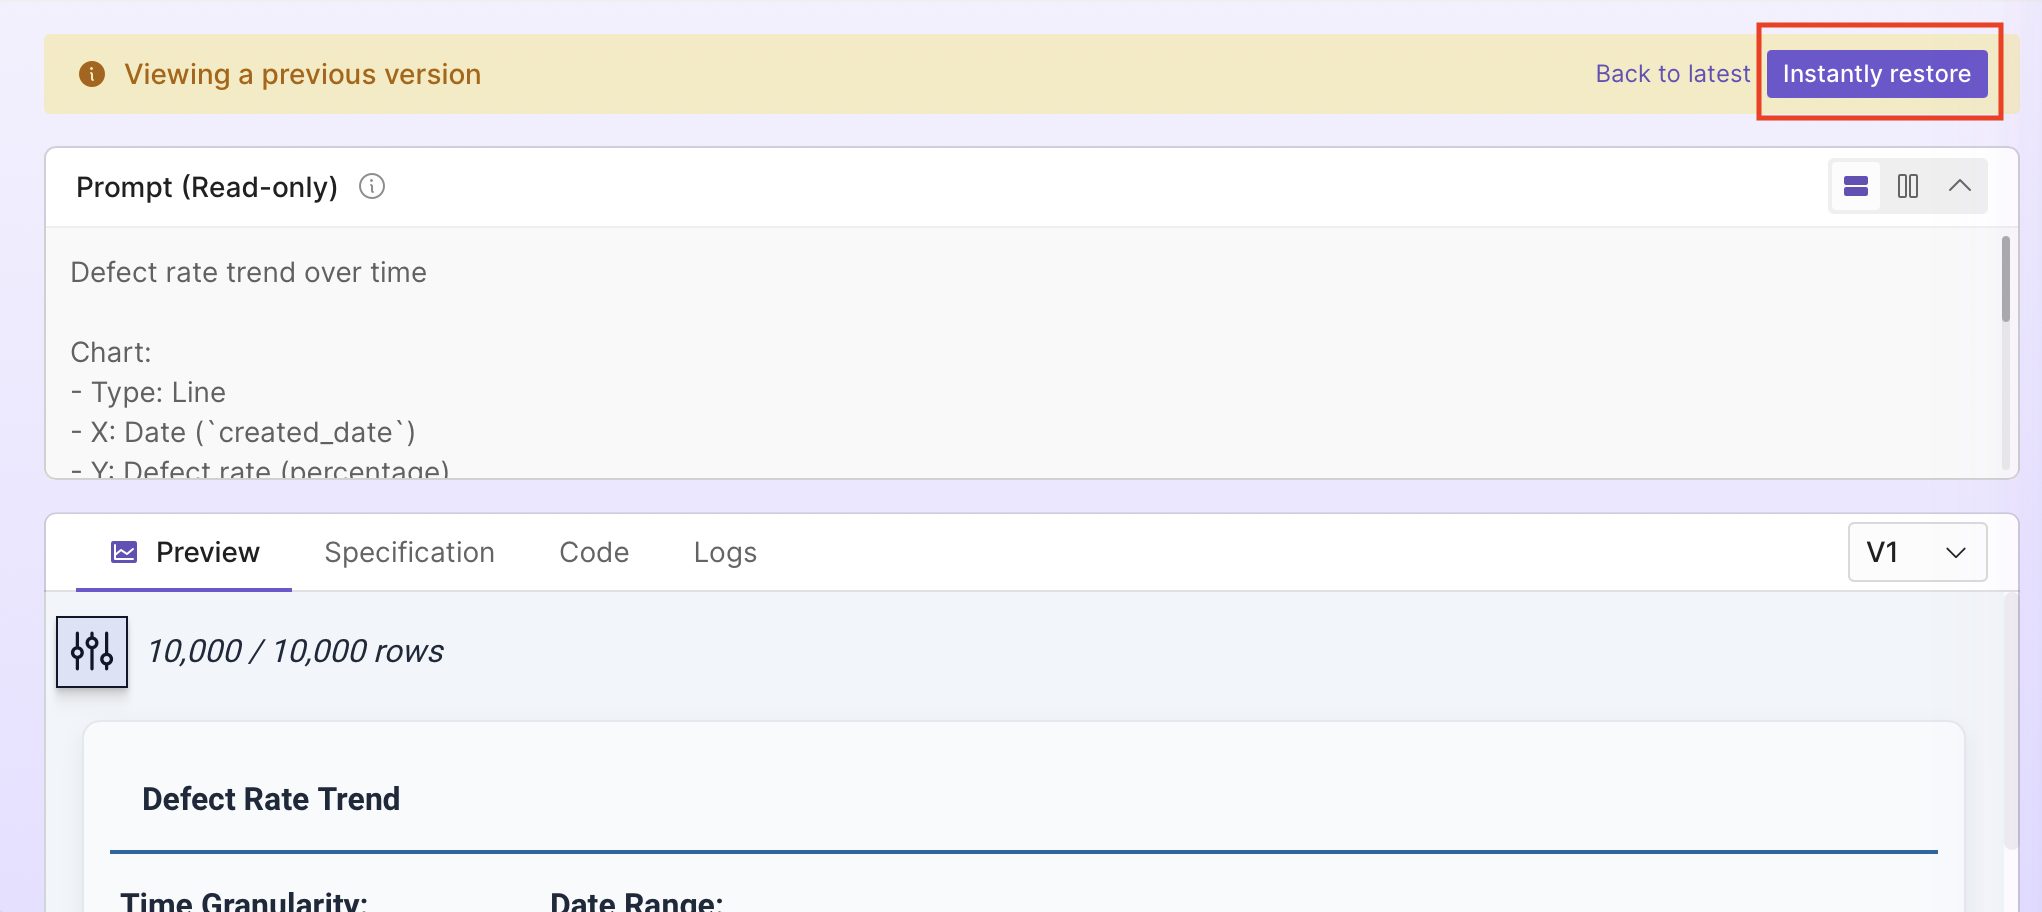
Version history
Plotly Studio tracks versions of your components as you work. Each time you edit a component, a new version is saved. Select the version dropdown to view previous versions and how each version was created (through a code or prompt update).
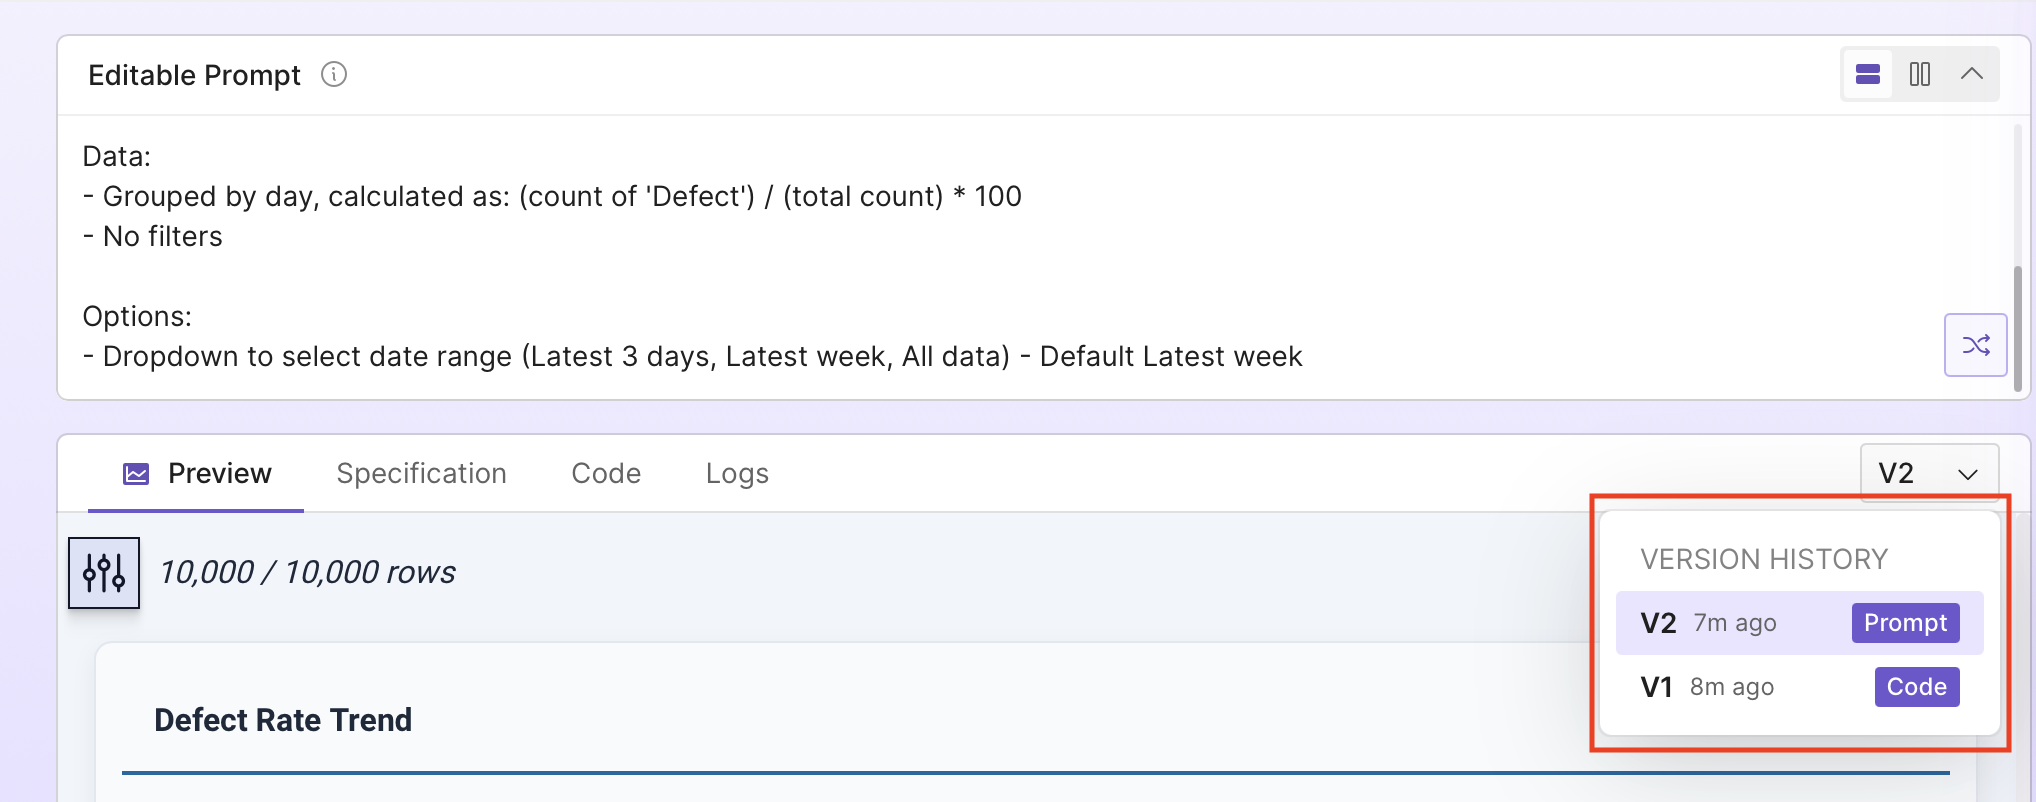
Select a previous version to view its contents in read-only mode. To restore it, select Instantly restore. This creates a new version with the restored content, preserving the full version history.