Sessions
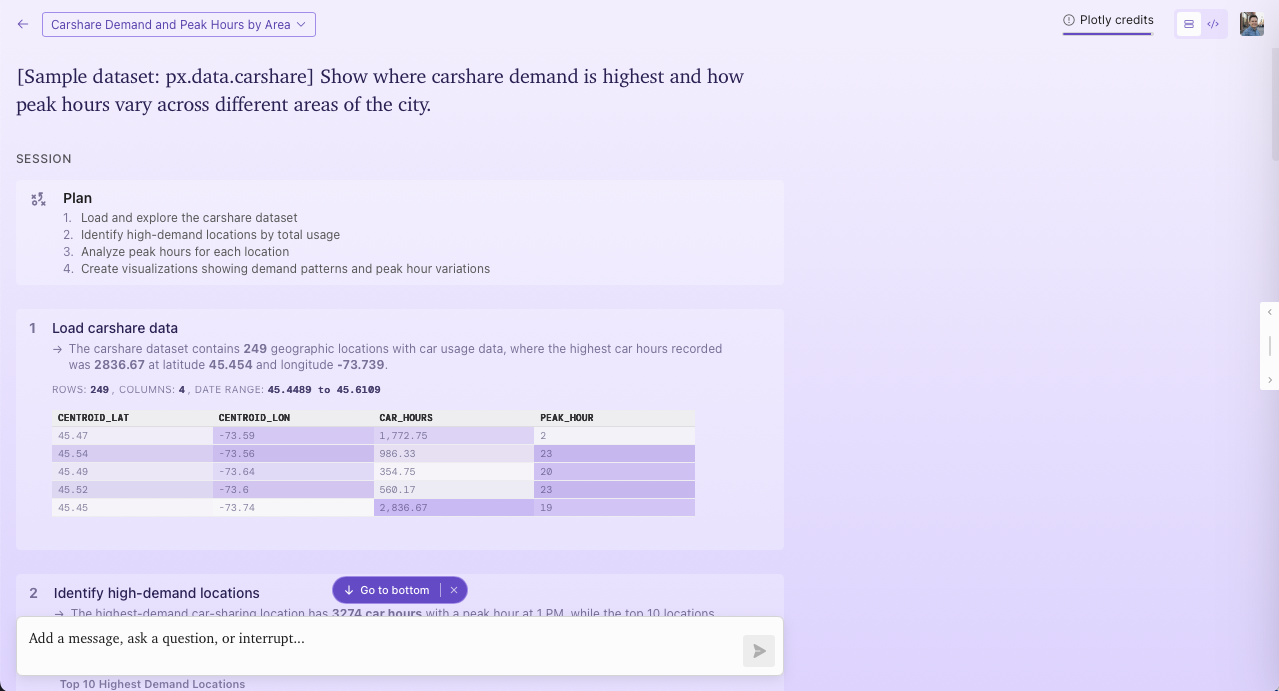
A session is a conversation with Plotly Studio's AI agent. Within a session you can upload or connect to data, ask ad-hoc questions, explore visualizations, request written summaries, and build shareable data apps.
How sessions work
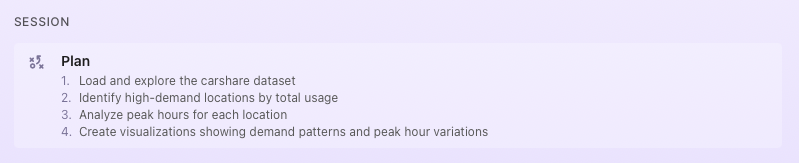
When you send a prompt, the agent plans a series of steps to fulfill your request, then executes them one by one. Each step represents a discrete unit of work, such as loading data, running a calculation, generating a chart, or writing a summary.
The agent writes and runs Python code behind the scenes for each step. You never need to write code yourself, but you can inspect it at any time (see Viewing step details).
Managing sessions
Creating a new session automatically adds it to a project. You can delete a session from the project screen. Or all sessions as a result of deleting a project. To delete a session, select the Session Menu within the Project screen and select Delete.
Installing dependencies
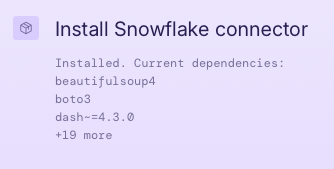
Plotly Studio installs dependencies dynamically from PyPI during the course of a session. You can request a specific package by naming it directly, or allow Plotly to determine the appropriate package based on a general request. Custom package servers are not yet supported at this time.
When the agent asks for guidance
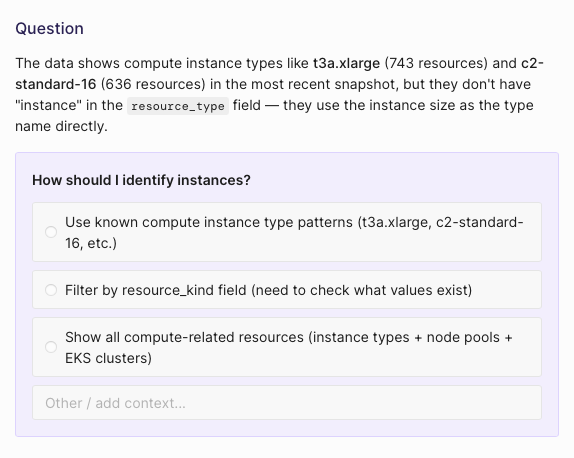
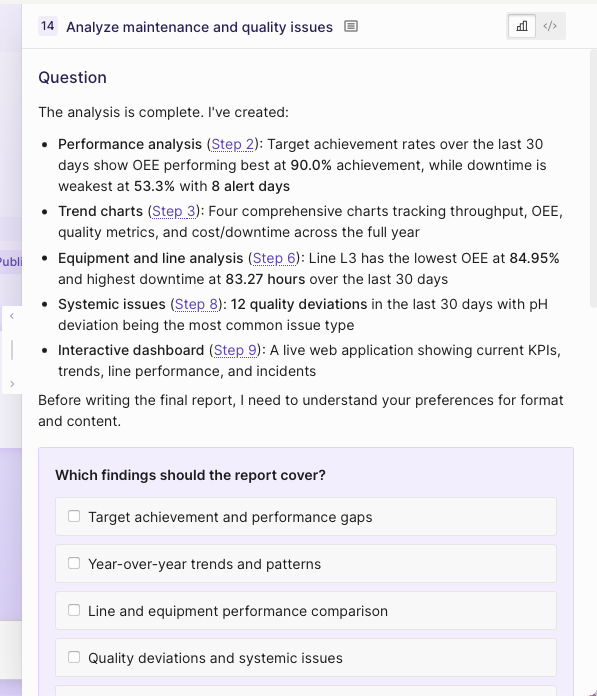
If the agent encounters an ambiguous situation, it will pause and ask you a clarifying question before continuing. For example, if it's unclear how to interpret a column in your data, or two approaches seem equally valid, you can answer in the chat to let the agent proceed.
Viewing step details
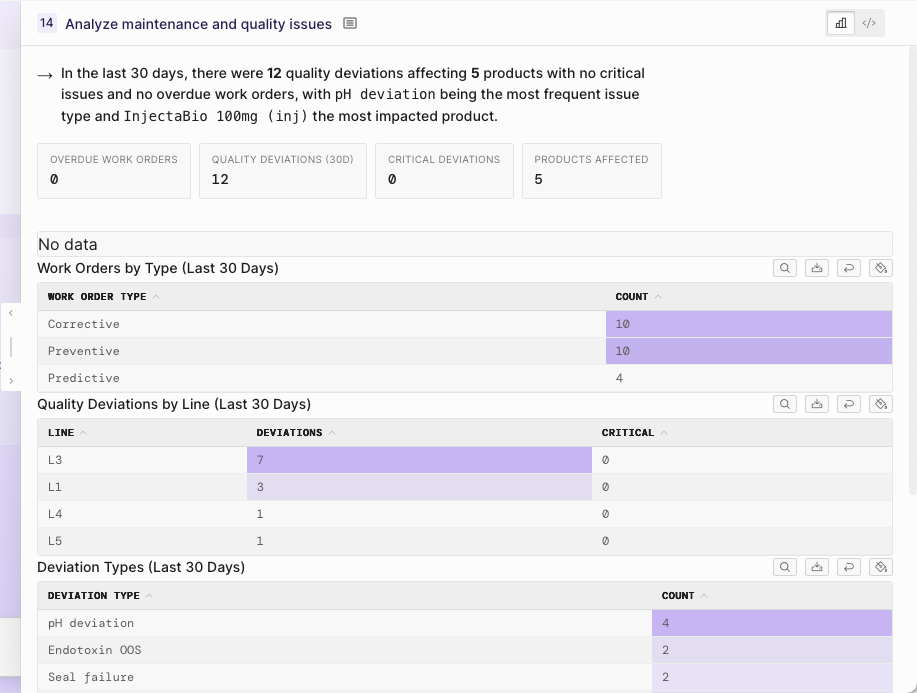
Select any step in the session to open the side panel. The side panel gives you a closer look at what the agent did and what it found:
- Visualizations: Expand charts and tables to view them in detail.
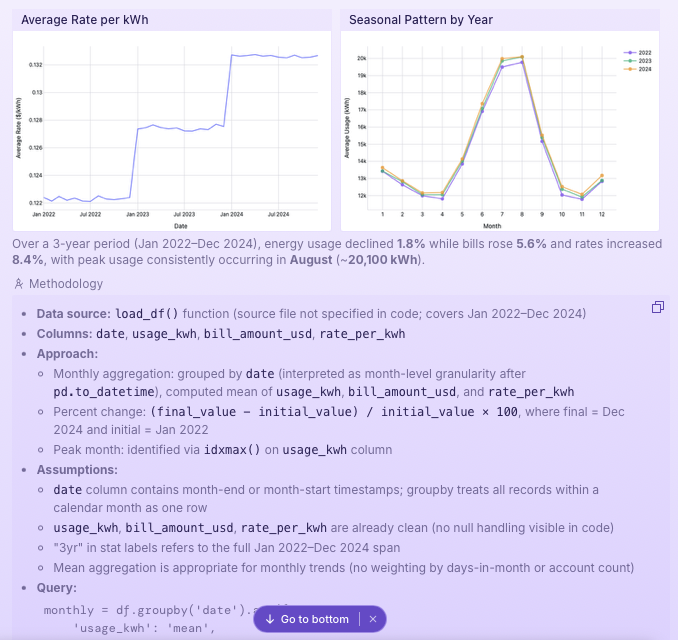
- Summary: A plain-language description of the results, written by the agent. Key statistics and figures (shown in bold) are interpolated directly from the code output, ensuring that every number comes from executed code rather than the model's general knowledge. This approach eliminates fabricated statistics, a common source of AI hallucinations.
- Methodology: Select Methodology to open validation details for the step. Depending on the step, this section can include data sources, data columns, approach, assumptions, queries, limitations, and more. Methodology is generated from executed code so it stays as accurate as possible.
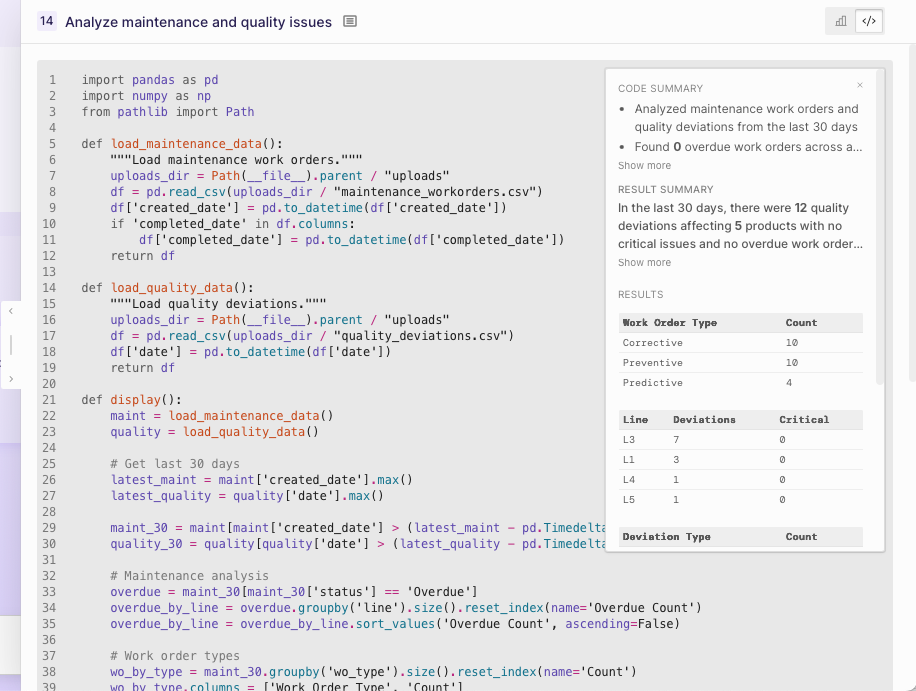
- Code: The Python code that produced the result. You can review it to understand exactly what the agent did at each step.
Data sources and credentials within a session
If your data source requires credentials (for example, a database connection or API key), the agent opens the Credentials panel so you can enter them securely. Credentials entered within a session are automatically promoted to project-level. Credentials are shared with every other session in that project, so you only need to enter them once. To see all credentials within your project, navigate to the project overview screen and select Manage project credentials from the top toolbar.
See Data Sources for full details on connecting to external data.
Artifacts
During a session, you can ask the agent to produce structured outputs called artifacts, such as charts, tables, reports, and apps. If your session belongs to a project, artifacts are shared across every session in that project instead of staying scoped to the session that created them.
Reports
Ask the agent to produce a written report or summary of your findings. When building a report, the agent will ask you a series of questions to tailor the output, such as:
- Which findings to include
- The level of detail (executive summary vs. deep dive)
- How much editorial commentary to add alongside the data
Like all summaries in Studio, facts and figures in a report are interpolated from executed code, not generated from the model's world knowledge.
Data apps
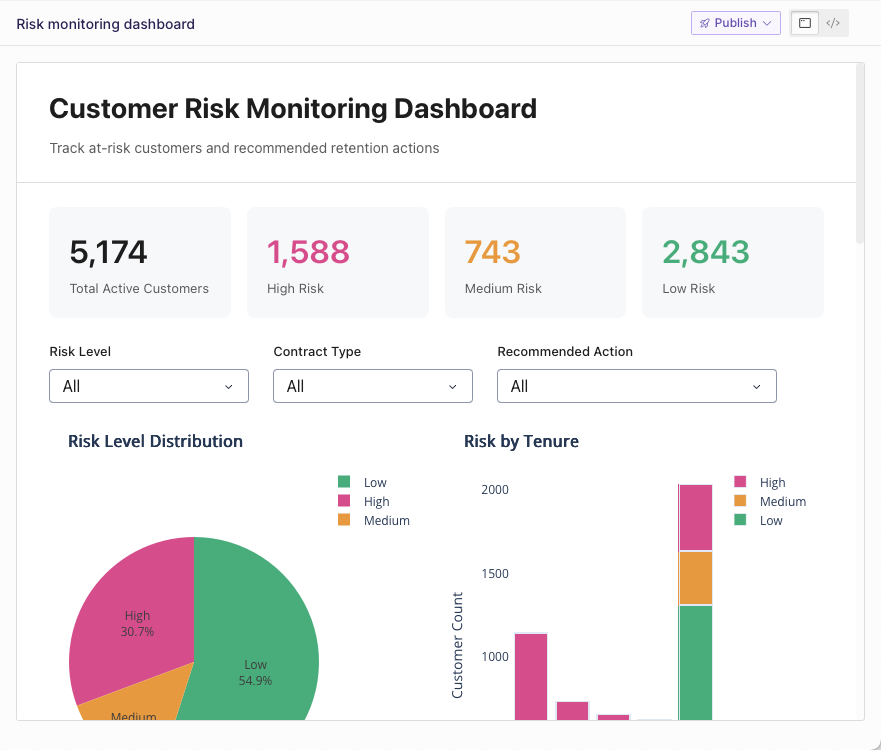
Ask the agent to build an interactive data app. The agent creates a Dash app with charts, tables, and controls based on your session data. You can iterate on the app through follow-up prompts. Iterations update the same artifact in place, and Plotly Studio keeps a version history you can roll back to.
Once you're happy with the result, you can publish the app to Plotly Cloud or Dash Enterprise. See Publishing for details.
Artifact versions within a session
Artifact versions are automatically tracked as the agent makes edits. Selecting an artifact within a step shows you a snapshot of its state at that point in time. Note, this may not be its current state within your project. To see the current state, scroll to the last step in which the artifact was referenced, or navigate to the project overview screen. The project overview screen is also the best place to compare versions.