Treemaps
Treemap charts visualize hierarchical data using nested rectangles. Treemaps are useful for showing hierarchical data and part-to-whole relationships, with rectangle sizes proportional to their values, helping you see both the overall hierarchy and individual proportions. You can show multiple levels of hierarchy, use color to encode additional dimensions, and apply styles and customizations like custom colors and text labels.
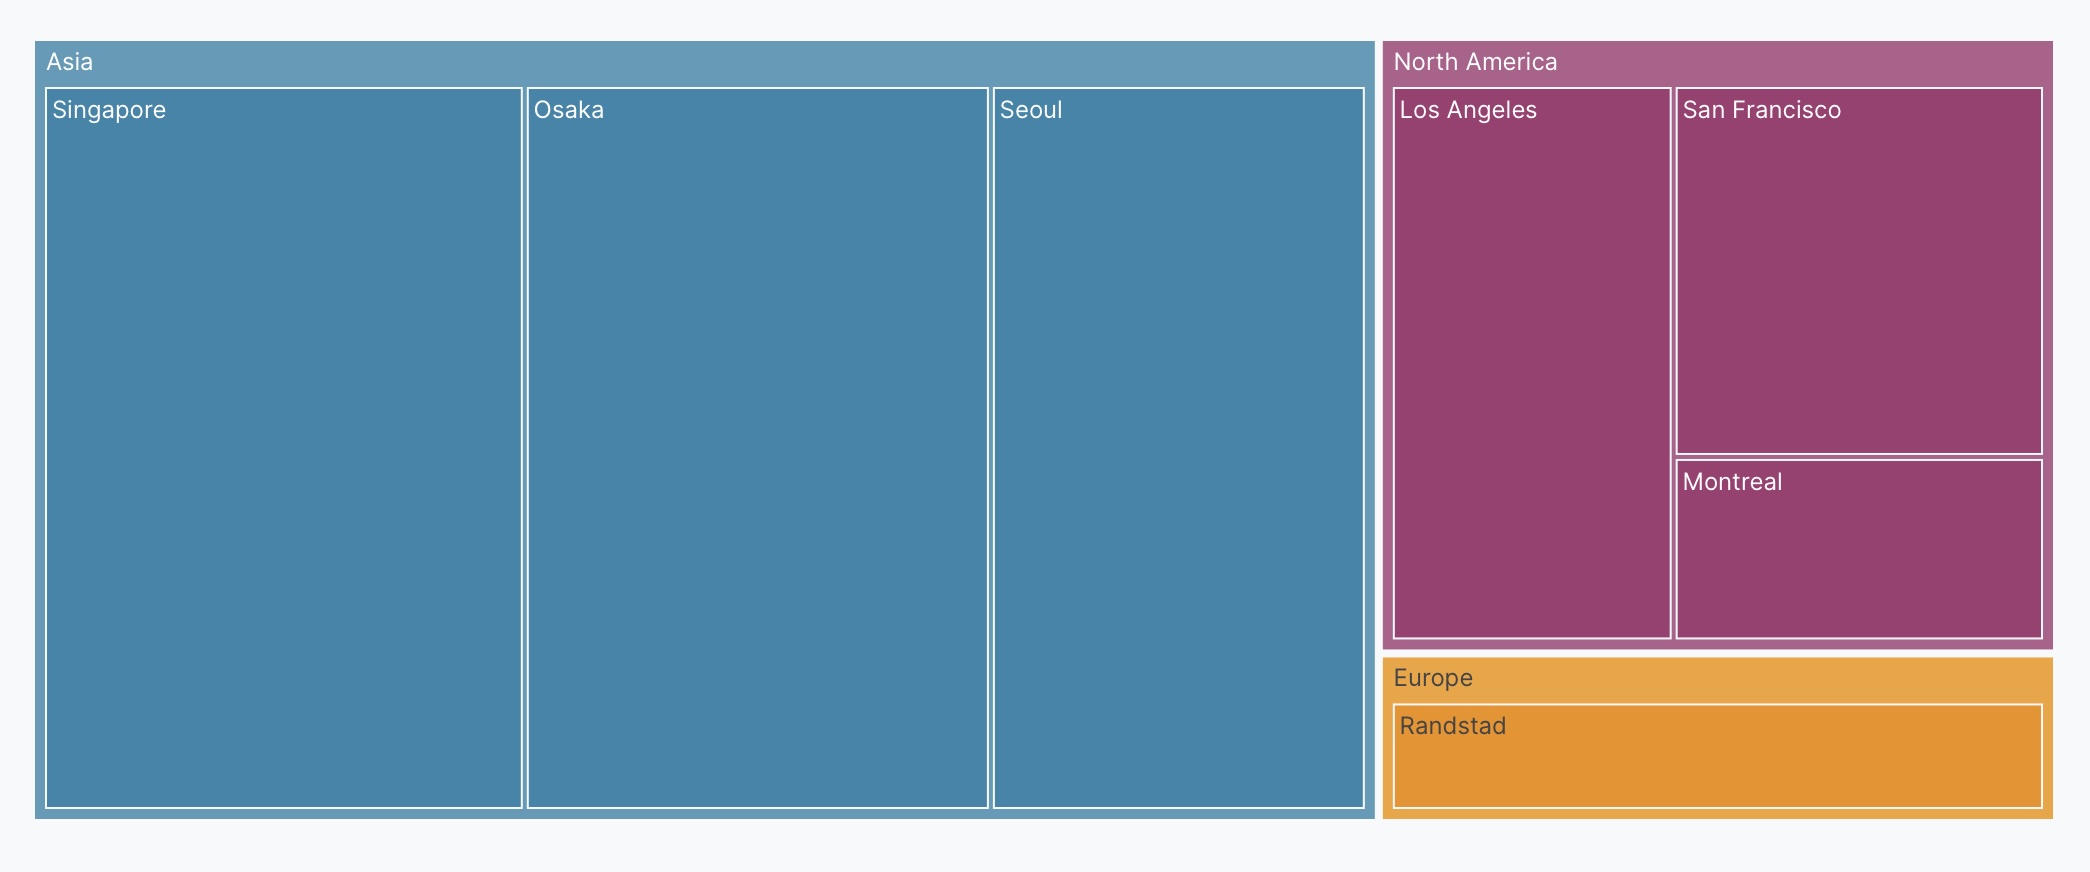
Basic treemap example
Example of showing hierarchical data with nested categories.
Create a treemap of <Values> by <parent_category> and <child_category>.
The following example uses this prompt structure with the region and factory_location columns from the built-in Plotly Studio dataset, with a computed field to group factories by region:
Create a treemap of count of products by region and factory location.
Region is based on factory location
(Montreal/Los Angeles/San Francisco → North America;
Seoul/Singapore/Osaka → Asia; Randstad → Europe).
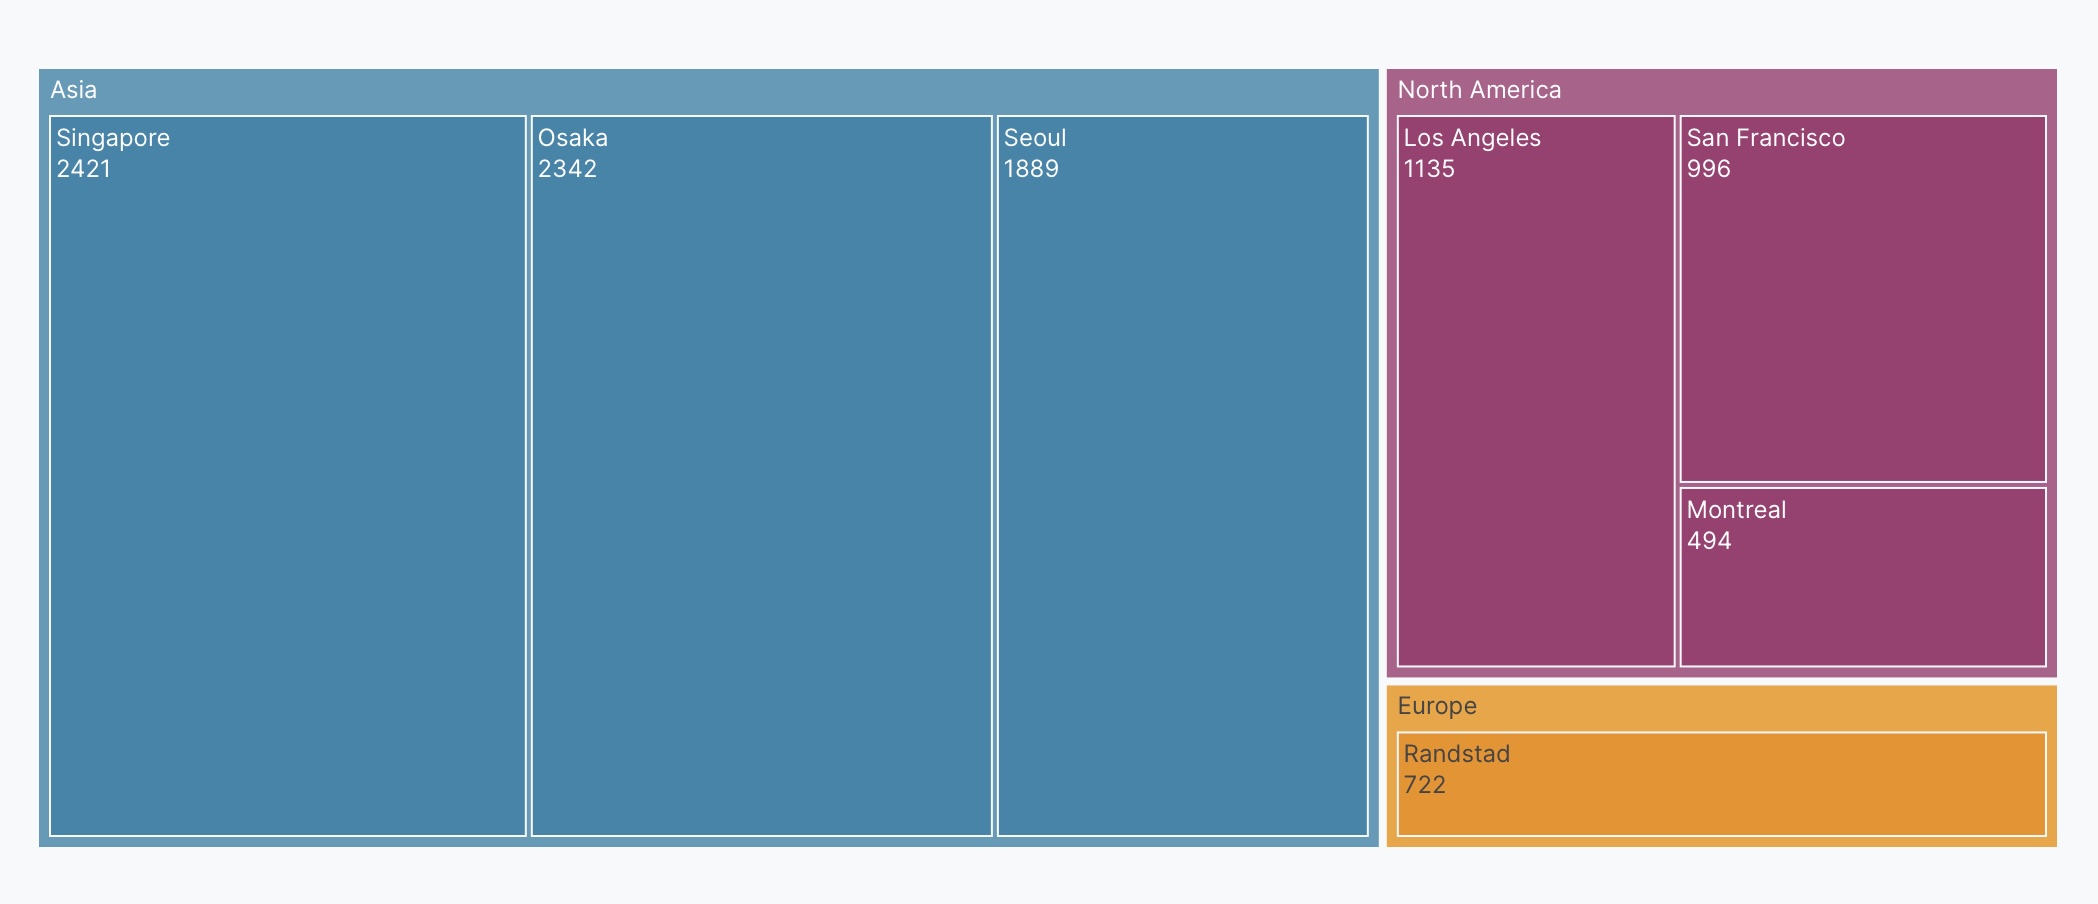
Text on rectangles
Control what text appears on each rectangle (labels, values, percentages, or combinations).
Create a treemap of <Values> by <hierarchy_levels>. Show <text_type> on rectangles.
The following example uses this prompt structure with the region and factory_location columns from the built-in Plotly Studio dataset:
Create a treemap of count of products by region and factory location.
Region is based on factory location
(Montreal/Los Angeles/San Francisco → North America;
Seoul/Singapore/Osaka → Asia; Randstad → Europe).
Show labels and values on rectangles.
Interactive controls
Add dropdowns and other controls to make your treemaps interactive. Controls let users filter and explore the data dynamically.
Create a treemap of count of products by region and factory location.
Region is based on factory location
(Montreal/Los Angeles/San Francisco → North America;
Seoul/Singapore/Osaka → Asia; Randstad → Europe).
Add a dropdown to select region (All, North America, Asia, Europe) - Default All.
Add a checkbox to toggle value labels - Default show labels.
Prompt keywords reference
Use these keywords and phrases in your prompts to customize your treemap.
Chart
Here are some keyword suggestions to create and customize a chart:
| Keyword/Phrase | Description | Example |
|---|---|---|
| Path | The hierarchical levels to display (parent to child) | by region and factory location |
| Values | The column to use for rectangle sizes | count of products |
| Color | Color rectangles by category or value | color by defect |
Data
Specify data instructions in your prompt to transform, filter, or aggregate your data before visualization.
Count products by region and factory location.
Region is based on factory location
(Montreal/Los Angeles/San Francisco → North America;
Seoul/Singapore/Osaka → Asia; Randstad → Europe).
Here are some keyword suggestions:
| Keyword/Phrase | Description | Example |
|---|---|---|
| Aggregation | Specify how to aggregate data | count products by region and factory location |
| Computed field | Create new calculated fields from existing data | region is based on factory location (Montreal → North America, etc.) |
| Filter | Filter data to show only specific records | filter to show only defect = true |
Options
Specify options in your prompt to add interactive controls that allow users to dynamically filter, transform, and visualize data without regenerating the chart.
Add a dropdown to select region (All, North America, Asia, Europe) - Default All.
Add a checkbox to toggle value labels - Default show labels.
Here are some keyword suggestions. See App Controls for a complete list of control types and additional examples.
| Keyword/Phrase | Description | Example |
|---|---|---|
| Dropdown | Add a dropdown menu to filter by categories | Add a dropdown to select region (All, North America, Asia, Europe) - Default All |
| Checkbox | Add a checkbox to toggle options | Add a checkbox to toggle value labels - Default show labels |
Chart styles
Specify chart styles in your prompt to control the visual appearance and formatting of your treemap.
Use custom colors: #FF6B6B, #4ECDC4, #45B7D1.
Show labels and values on rectangles.
Set border width to 2.
Here are some keyword suggestions:
| Keyword/Phrase | Description | Example |
|---|---|---|
| Custom colors | Specify exact colors for categories | Use custom colors: #FF6B6B, #4ECDC4, #45B7D1 |
| Color scale | Color scale for continuous values. See built-in color scales | Use Viridis color scale |
| Text on rectangles | Control what text shows on rectangles | Show labels and values on rectangles |
| Text position | Where to position text on rectangles (top left, middle center, bottom right, etc.) | Position text insidePosition text in the middle center |
| Border styles | Customize border appearance | Set border width to 2 |
| Hover text | What to show when hovering over rectangles | Show average weight on hover |