Agentic Workflow Overview
Plotly Studio's agentic workflow is an AI-powered environment where you can explore data, answer questions, and build shareable apps—all through conversation. The agent works autonomously to carry out your requests, writing and executing Python code behind the scenes so you can focus on the analysis.
Start a project
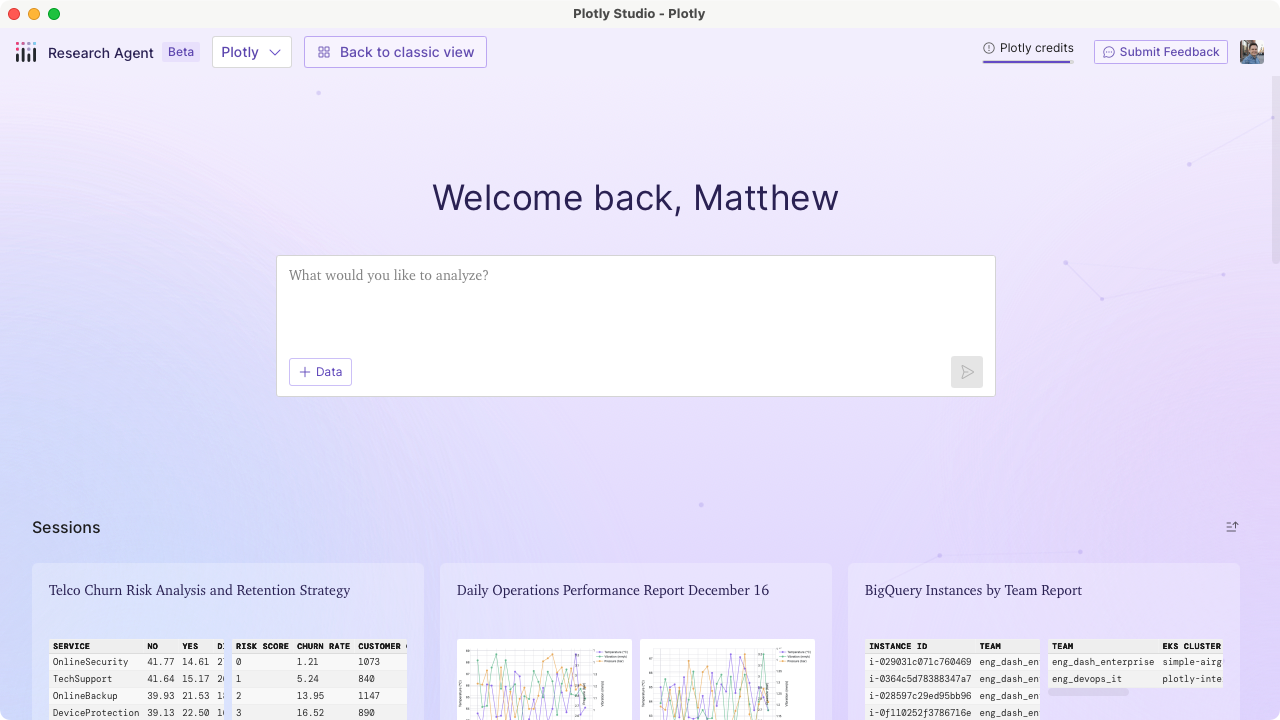
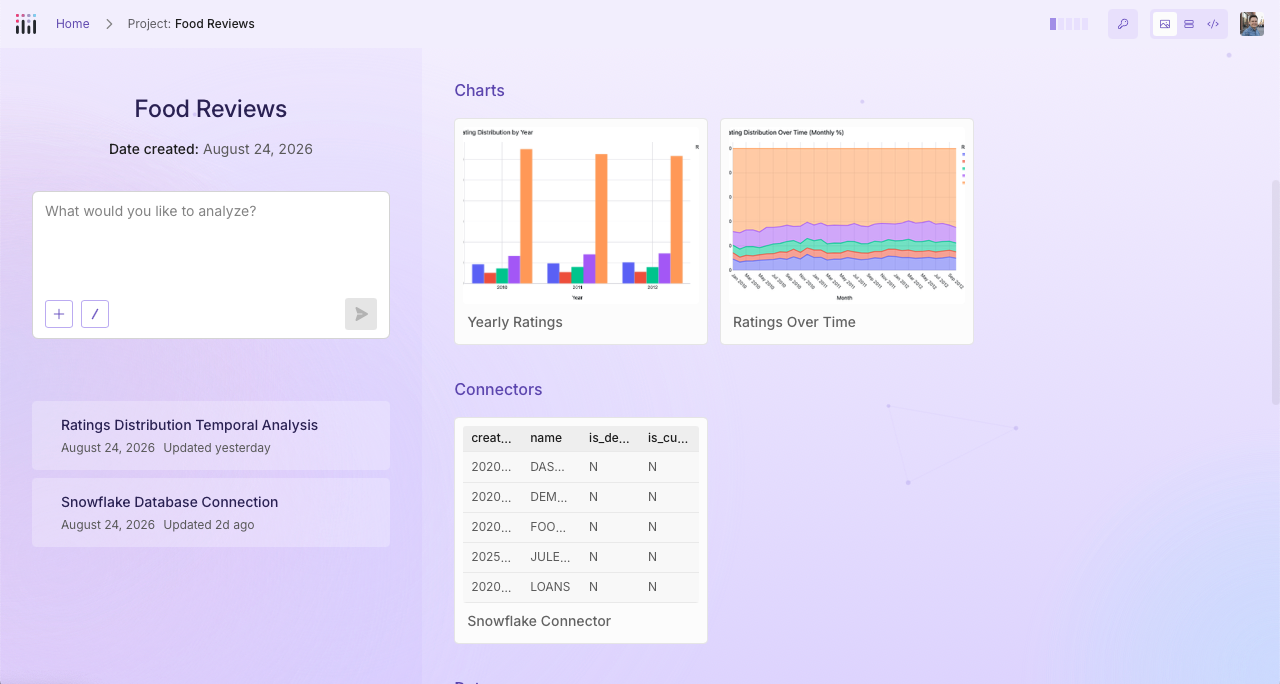
A project houses your data sources, credentials, sessions, and artifacts together, allowing you to work across multiple work streams from the same resources. Typically, you would create a separate project for each category of work you do, but how you divide that work is entirely up to you. For example, you might create separate projects for "Regional Sales Analysis" and "Product Telemetry Analysis".
Projects are automatically created when you start a session from the main page in Plotly Studio.
Work with your data
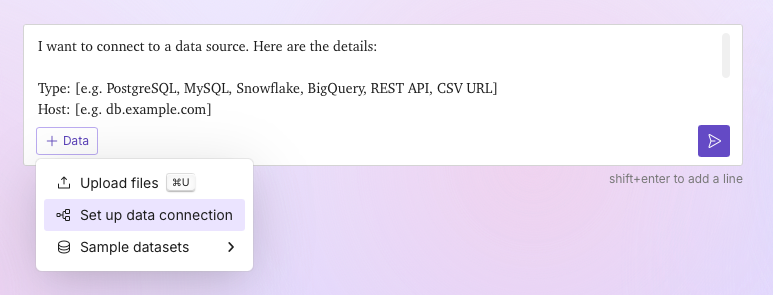
Upload files or connect to external data sources directly in Plotly Studio. The agent can read and query your data to answer questions and surface insights.
Chat with an AI agent
Chat with the agent and ask questions in plain language. The agent autonomously explores your data, runs analysis, and responds with results. You can ask follow-up questions and dig deeper without leaving the conversation.

Create visualizations and tables
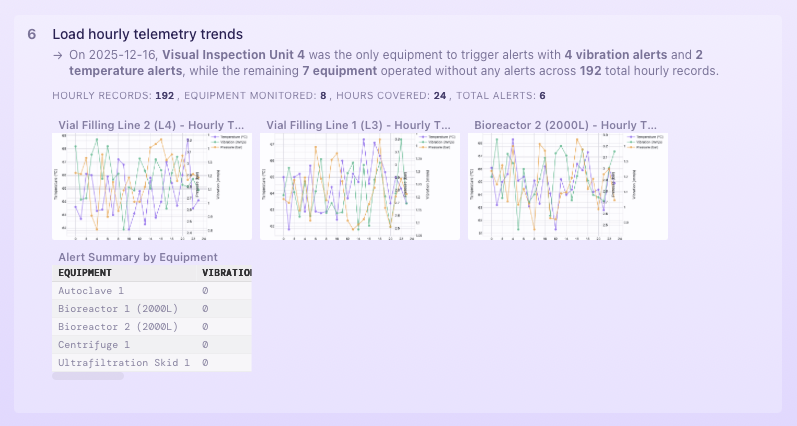
Ask the agent to create Plotly charts and tables. It writes the Python code, executes it, and returns the result—ready to include in a report or app.
Organize and find your work
Create one or more agentic sessions in a project, and view, search, and manage artifacts in a single interface.
Generate summaries
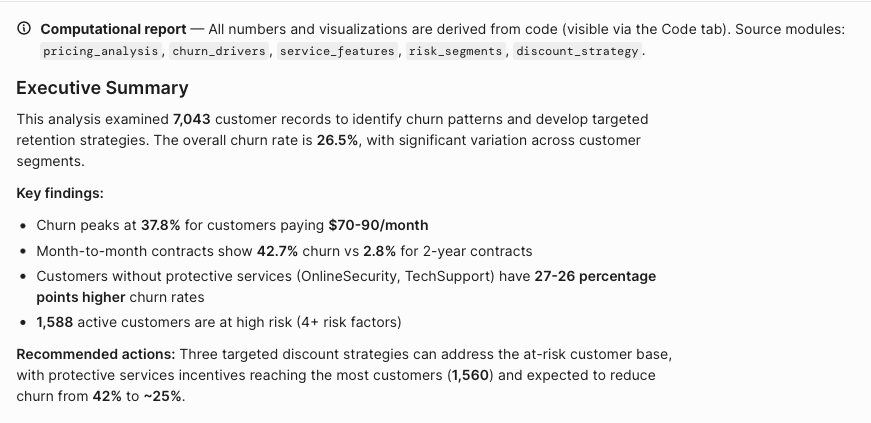
The agent provides written summaries alongside its results, highlighting key findings and suggesting new directions to explore.
Build reports and data apps
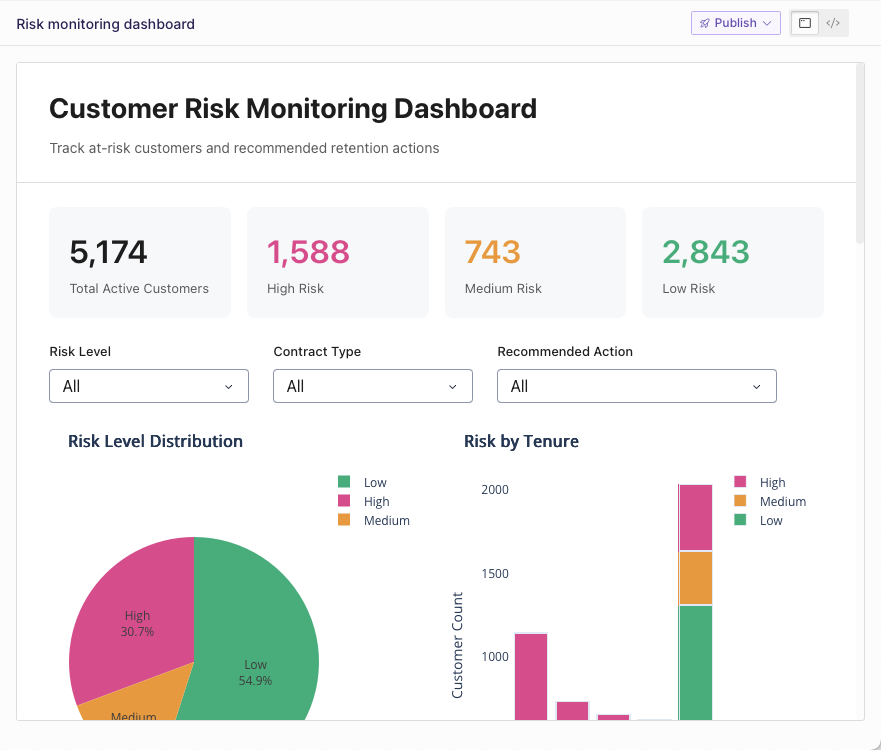
Turn your analysis into a polished report or a fully interactive data app built on Dash. Apps can include live charts, tables, and controls that let users filter and explore data on their own.
Publish your work
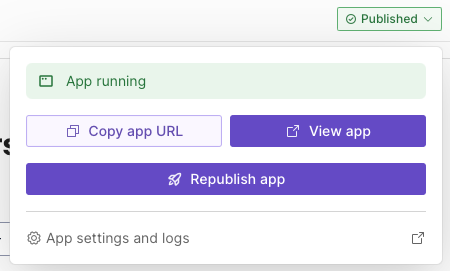
Publish artifacts from any session step to Plotly Cloud or Dash Enterprise. You can publish reports, data apps, or a single analysis step that includes its charts and tables.