Bar Charts
Bar charts are useful for comparing values across categories. You can also create grouped or stacked bars to compare multiple categories, and apply styles and customizations like colors, patterns, and text labels.
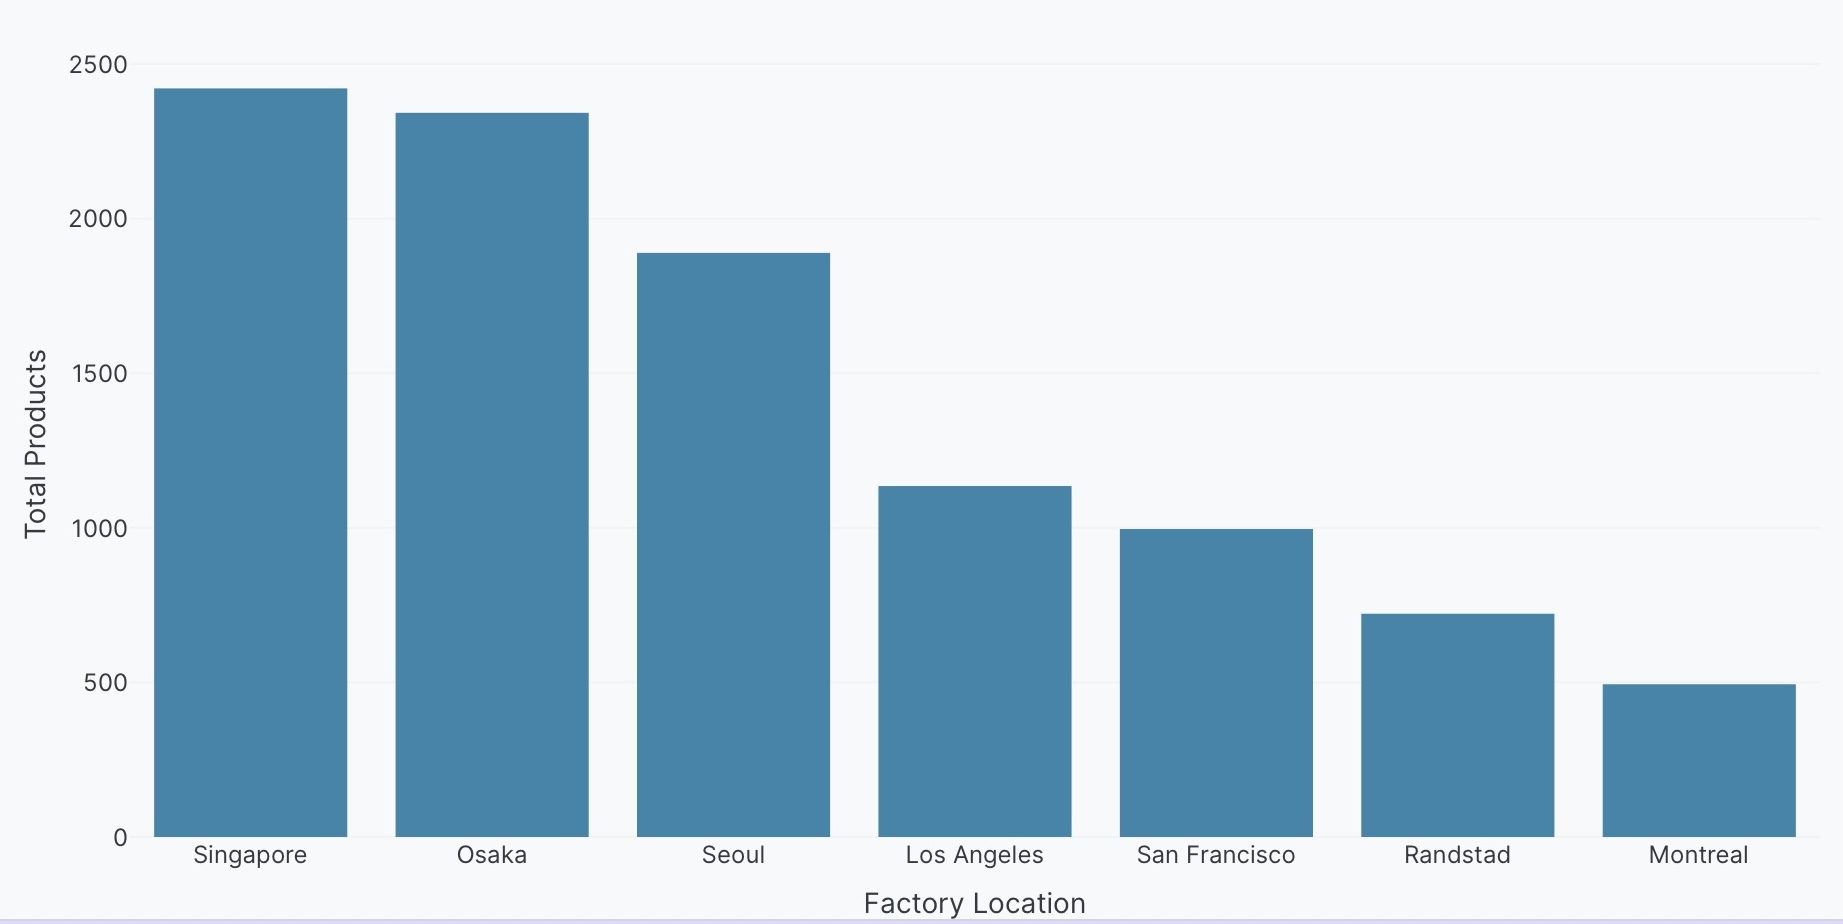
Basic bar example
Example of comparing counts across categories.
Create a bar chart of <Y> by <X>.
The following example uses this prompt structure with the factory_location column from the built-in Plotly Studio dataset:
Create a bar chart of count of products by factory location.
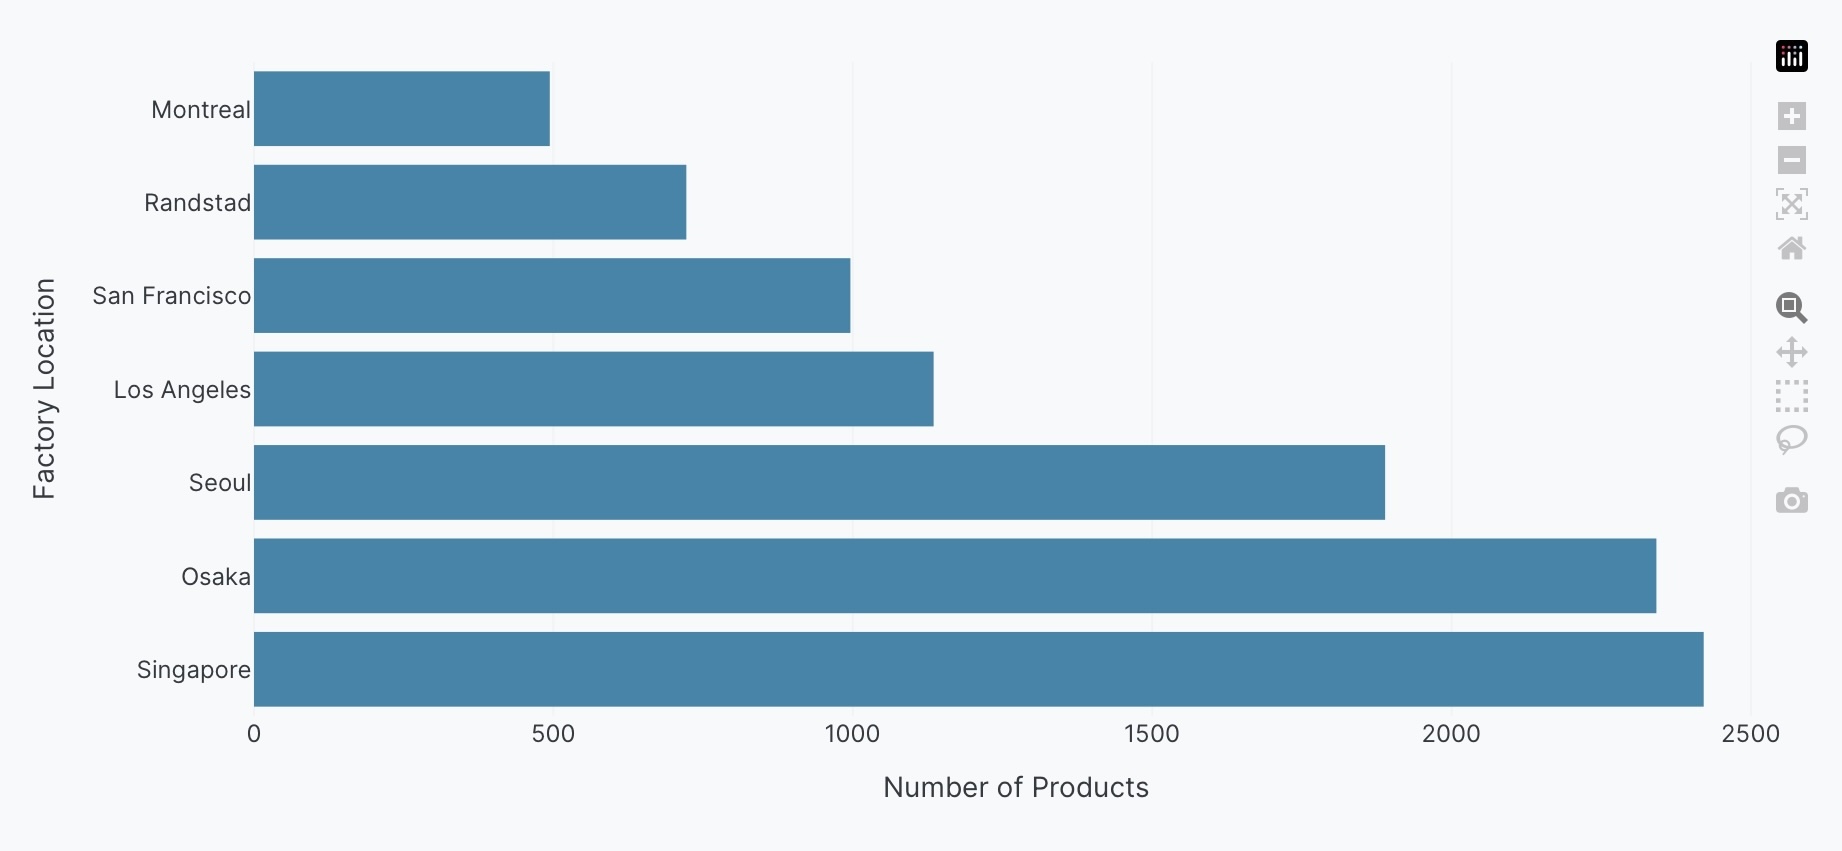
Horizontal bar charts
Create horizontal bars by setting the orientation.
Create a horizontal bar chart of <Y> by <X>.
The following example uses this prompt structure with the factory_location column from the built-in Plotly Studio dataset:
Create a horizontal bar chart of count of products by factory location.
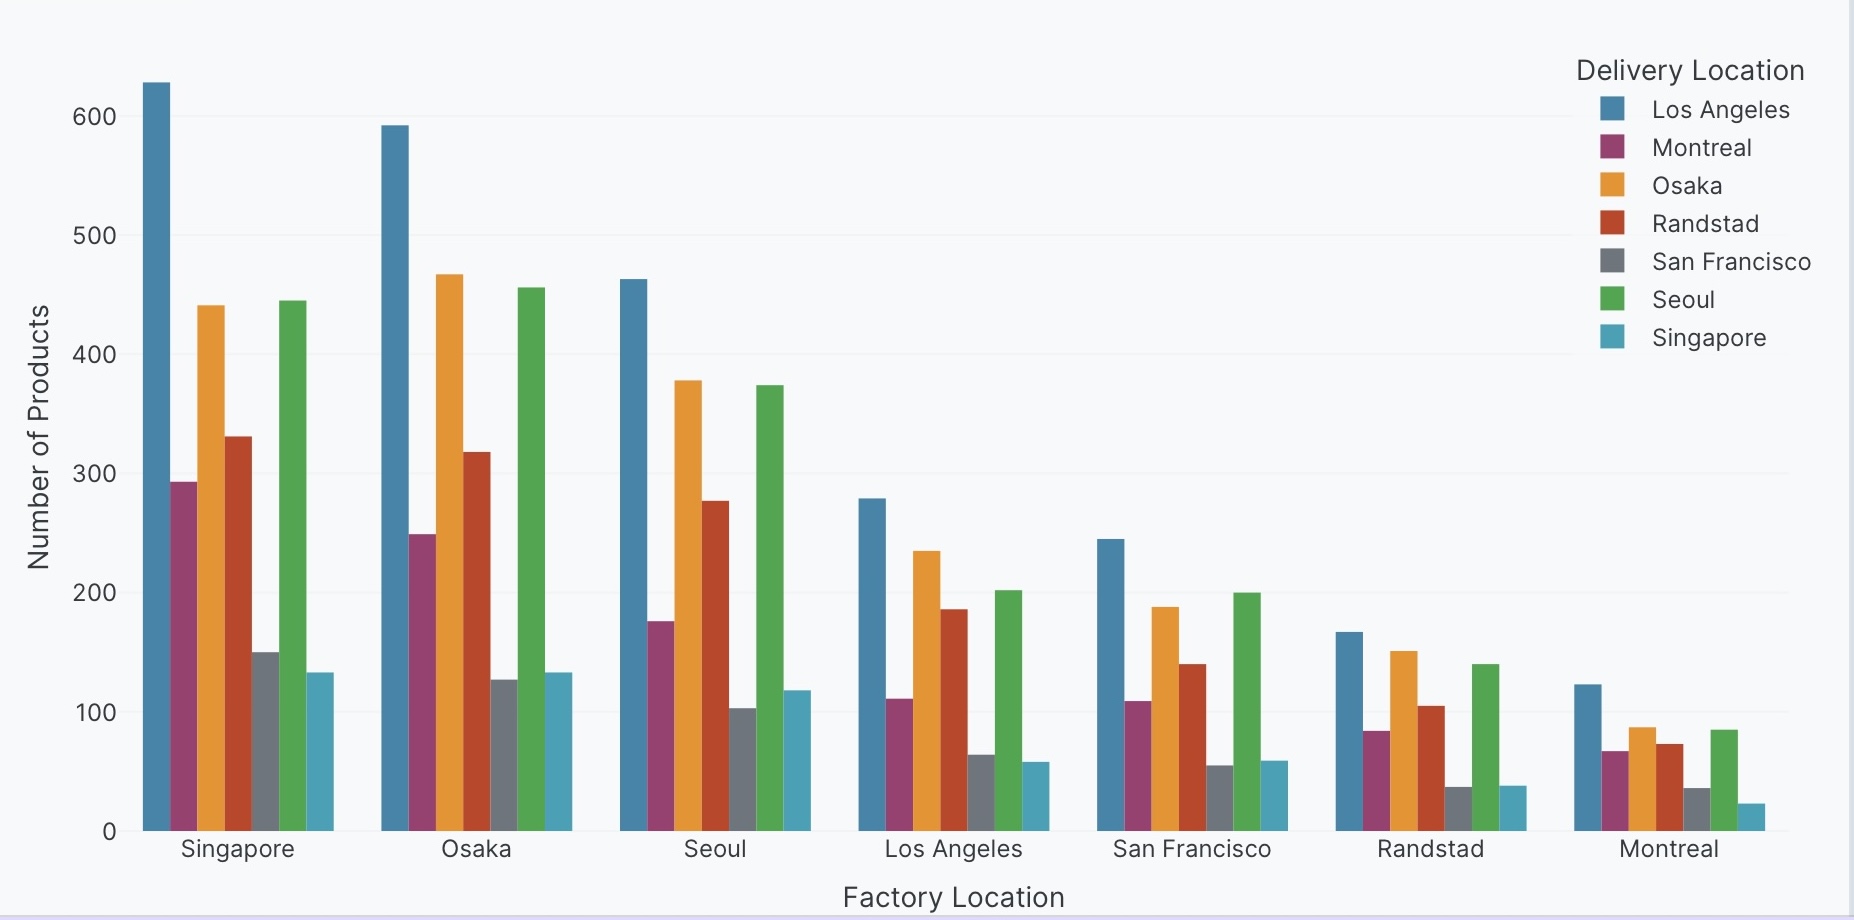
Grouped bar charts (side-by-side)
Create bars side-by-side to directly compare values between groups for each category.
Create a grouped bar chart of <Y> by <X>, color by <Column>.
The following example uses this prompt structure with the factory_location and delivery_location columns from the built-in Plotly Studio dataset to compare delivery destinations side-by-side:
Create a grouped bar chart of count of products by factory location,
color by delivery location.
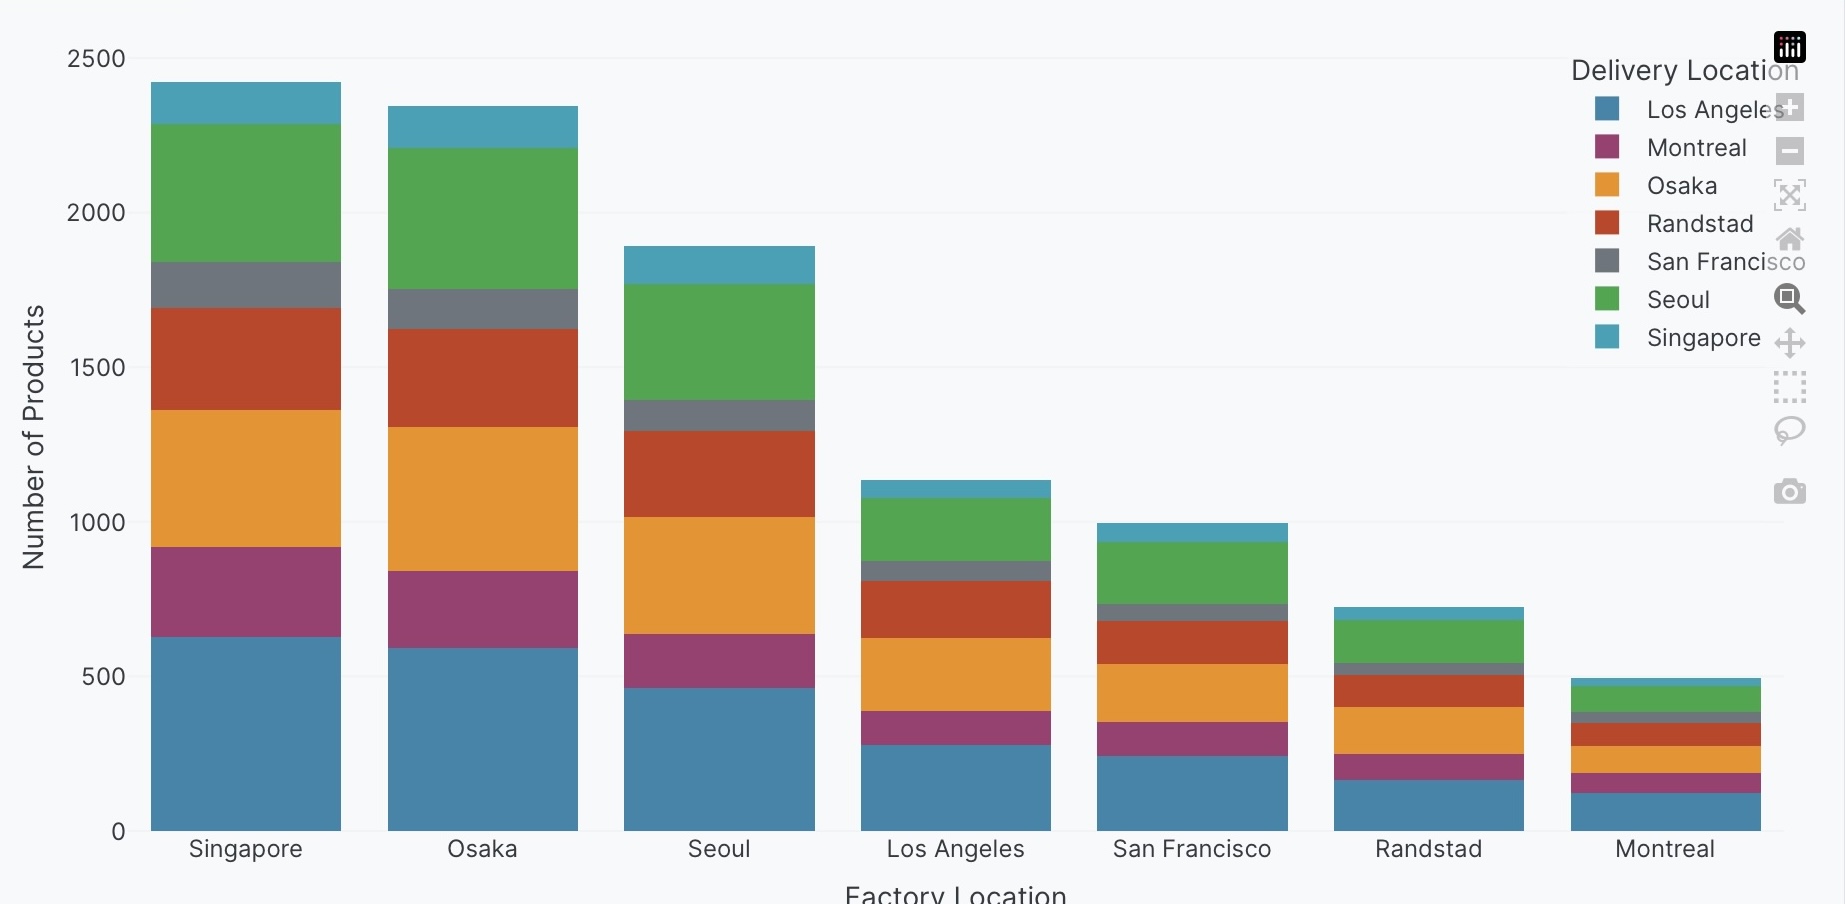
Stacked bar charts (bars on top of each other)
Stack bars on top of each other to show part-to-whole relationships and compare totals across categories.
Create a stacked bar chart of <Y> by <X>, color by <Column>.
The following example uses this prompt structure with the factory_location and delivery_location columns from the built-in Plotly Studio dataset to show stacked bars:
Create a stacked bar chart of count of products by factory location,
color by delivery location.
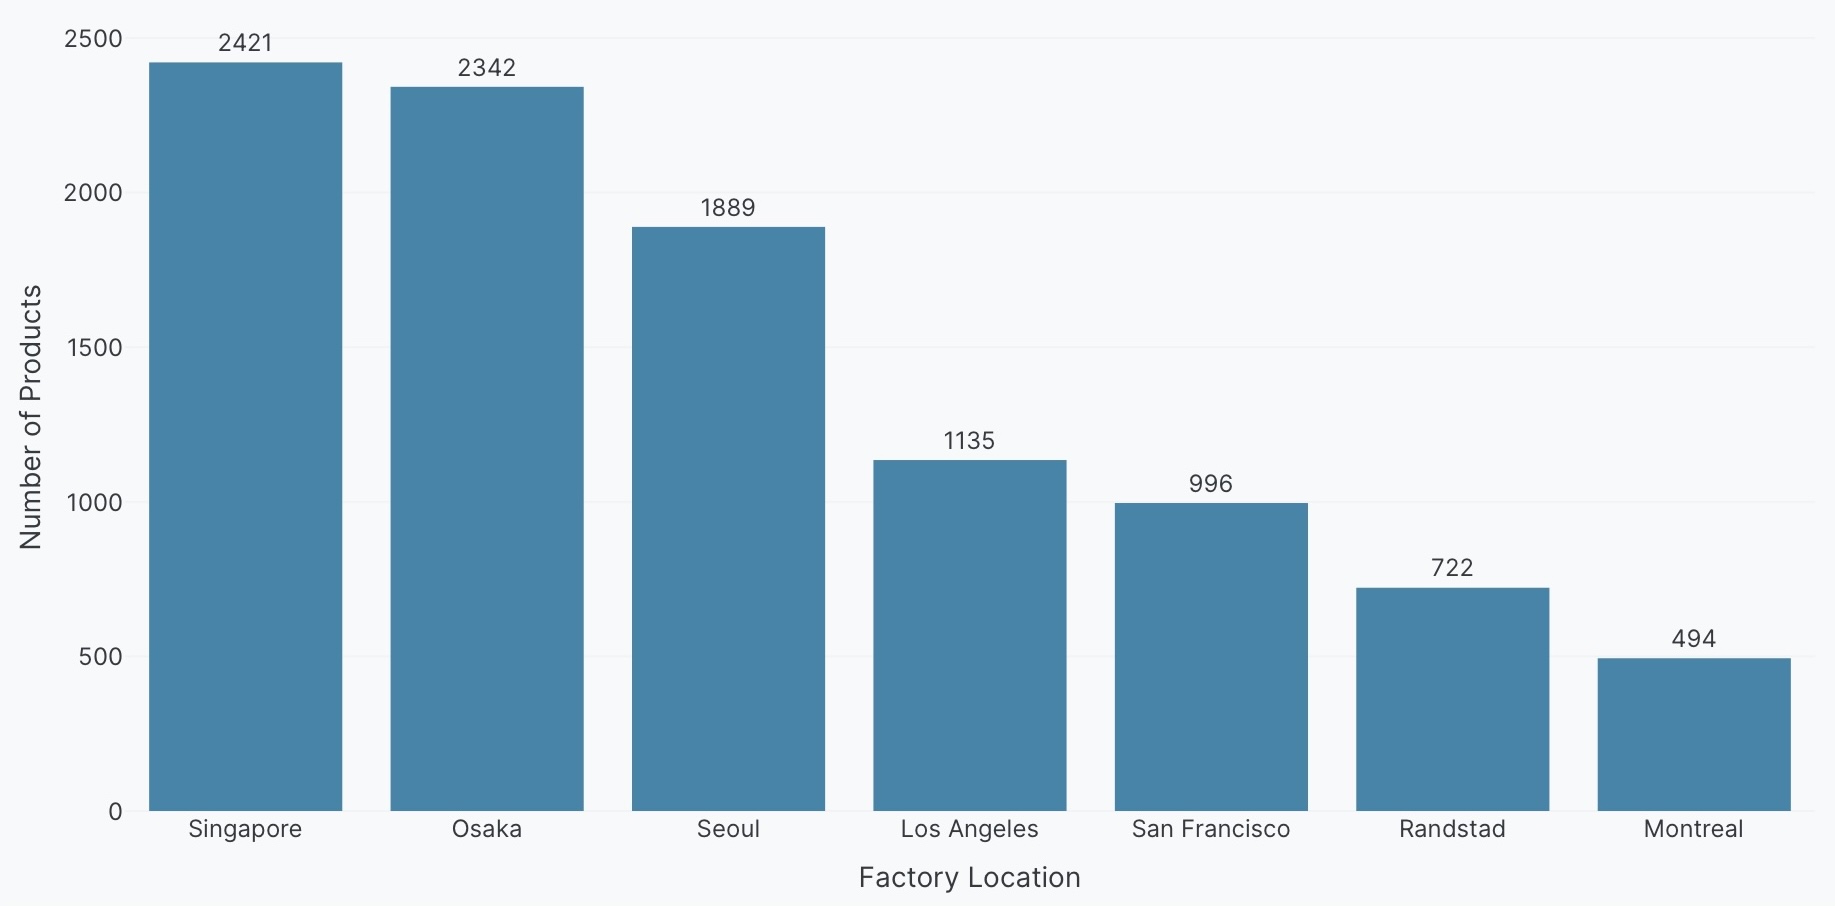
Bar charts with text
Display values directly on the bars to make it easier to read exact numbers.
Create a bar chart of <Y> by <X>. Show values on bars.
The following example uses this prompt structure with the factory_location column from the built-in Plotly Studio dataset to show product counts on each bar:
Create a bar chart of count of products by factory location.
Show values on bars.
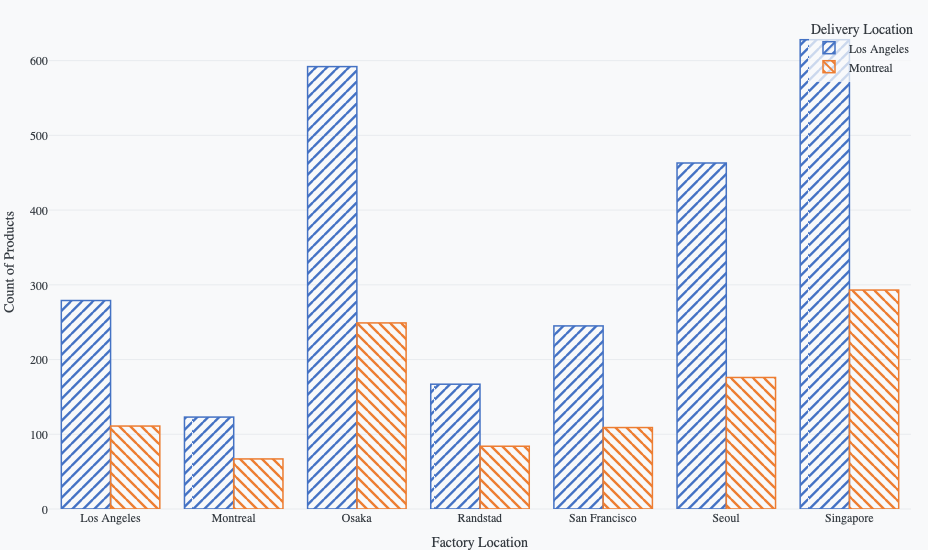
Pattern fills
Use patterns like dots, stripes, or crosses on bars to differentiate categories. This is particularly useful for accessibility and black-and-white printing.
Supported pattern shapes: forward diagonal /, backward diagonal \, vertical lines |, horizontal lines -, cross hatch x, plus/grid +, dots ., or solid (no pattern).
Create a grouped bar chart of <Y> by <X>, color by <Column>.
Use <pattern> patterns.
The following example uses the built-in Plotly Studio dataset to create grouped bars showing product counts by factory location, colored by delivery location. It filters to two delivery locations, applies diagonal patterns, and uses custom colors for the patterns and bar outlines:
Create a grouped bar chart of count of products by factory location,
color by delivery location.
Filter to Montreal and Osaka deliveries.
Use forward and backward diagonal patterns.
Use custom colors: #4472C4, #ED7D31.
Add bar outlines matching the bar colors.
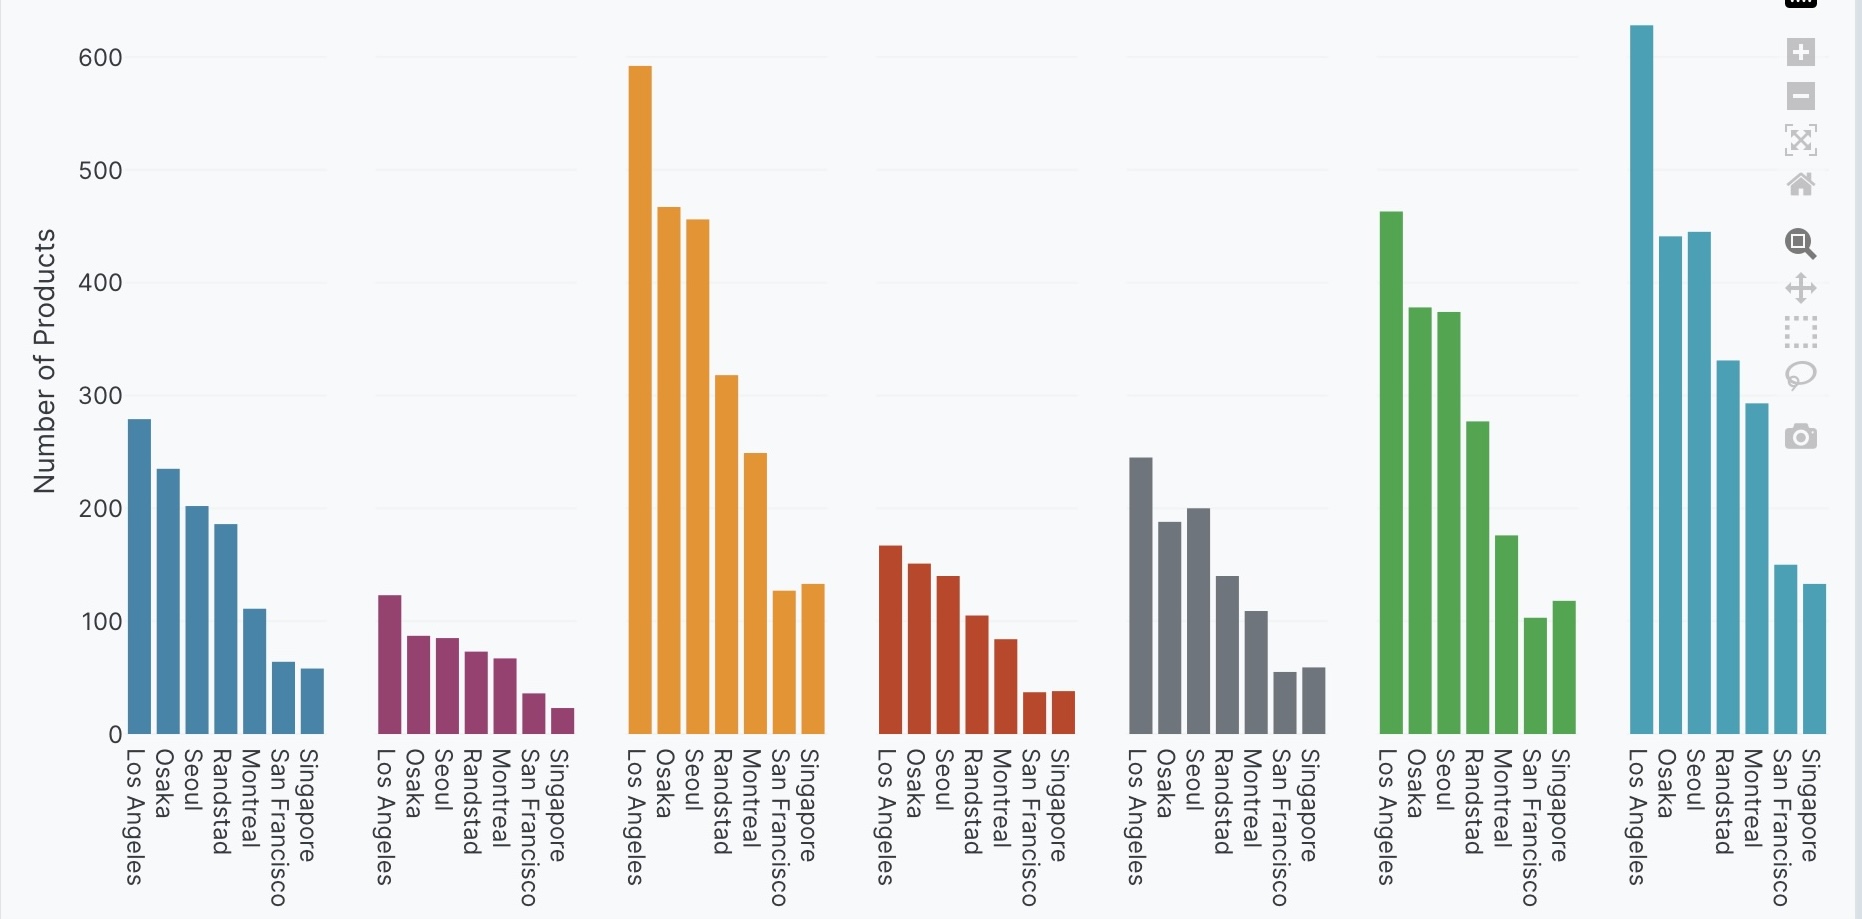
Multiple bar charts within one chart
Create multiple bar charts within one chart to compare different categories or patterns across groups. These charts, often known as faceted charts or small multiples, let you display separate subplots for each category side-by-side.
Create a bar chart of <Y> by <X>. Facet by <Column>.
The following example uses this prompt structure with the delivery_location and factory_location columns from the built-in Plotly Studio dataset to show separate subplots:
Create a bar chart of count of products by delivery location.
Facet by factory location.
Bar charts with custom hover text
Add additional information on hover to provide more context about the data.
Create a bar chart of <Y> by <X>. Include <additional_info> on hover.
The following example uses this prompt structure with the factory_location column from the built-in Plotly Studio dataset to show custom hover text:
Create a bar chart of count of products by factory location.
Include average_shipping_time on hover.

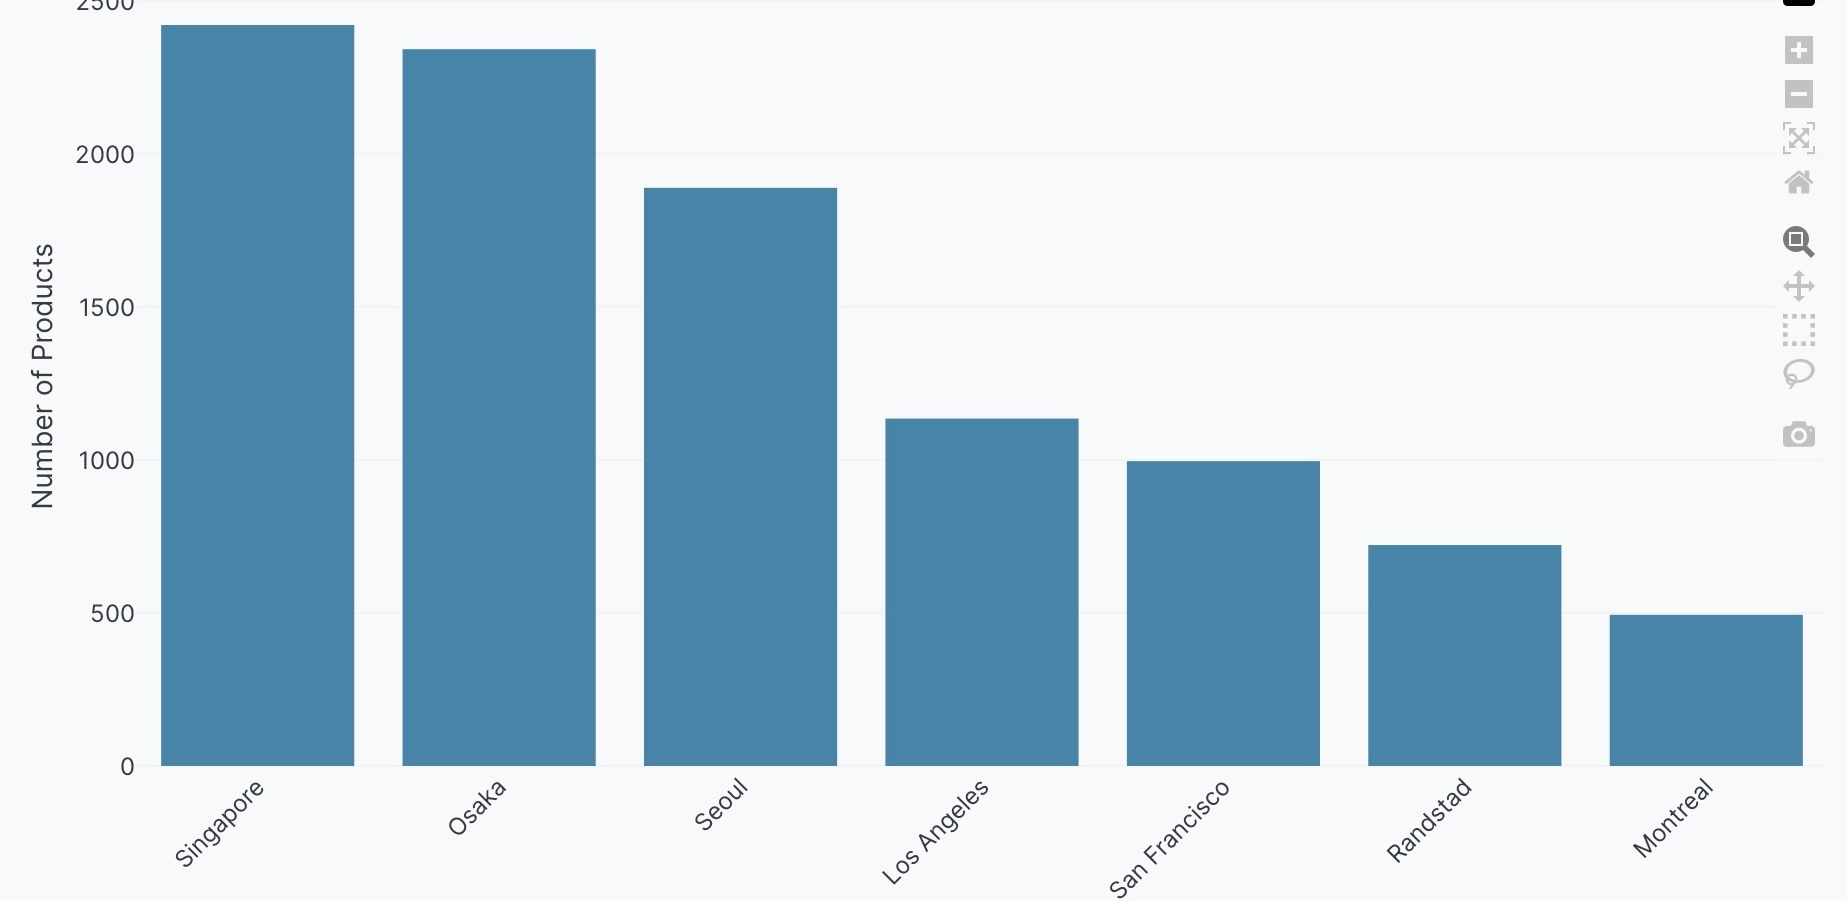
Rotated bar chart labels
Rotate x-axis labels to prevent overlapping when category names are long or numerous.
Create a bar chart of <Y> by <X>. Rotate x-axis labels <angle> degrees.
The following example uses this prompt structure with the factory_location column from the built-in Plotly Studio dataset to rotate labels:
Create a bar chart of count of products by factory location.
Rotate x-axis labels 45 degrees.
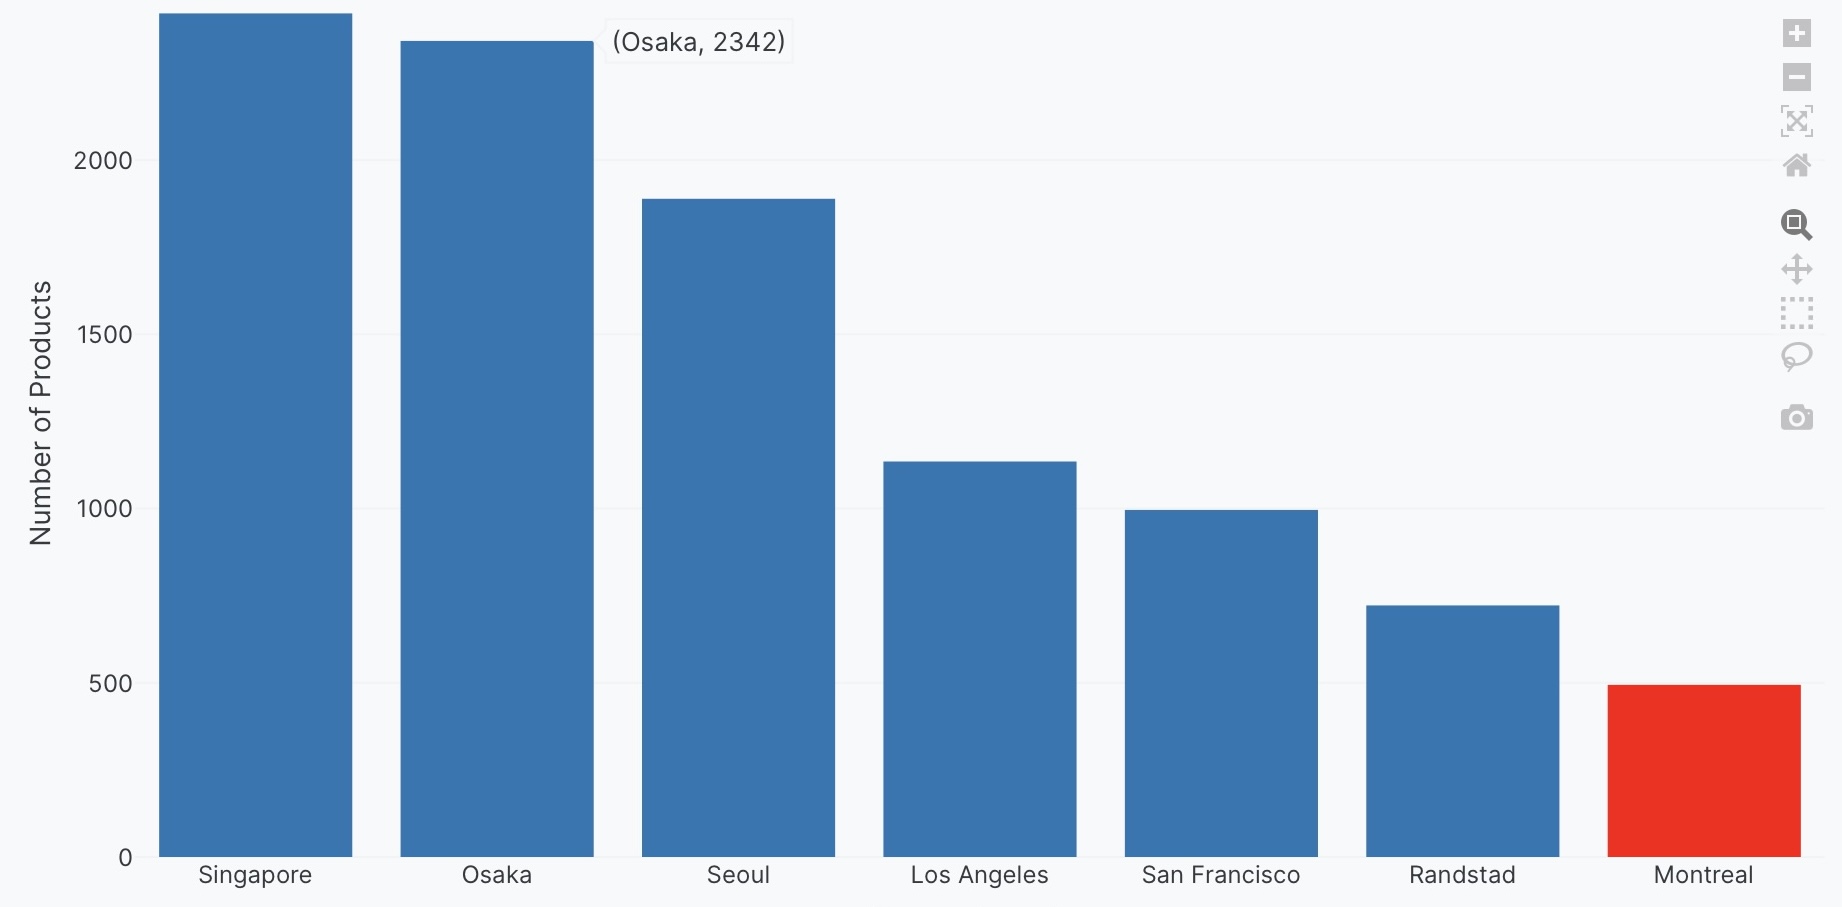
Customizing bar colors
Highlight a specific bar with a different color to draw attention to it.
Create a bar chart of <Y> by <X>. Highlight <value> in <color>.
The following example uses this prompt structure with the factory_location column from the built-in Plotly Studio dataset to highlight a specific bar:
Create a bar chart of count of products by factory location.
Highlight Montreal in red.
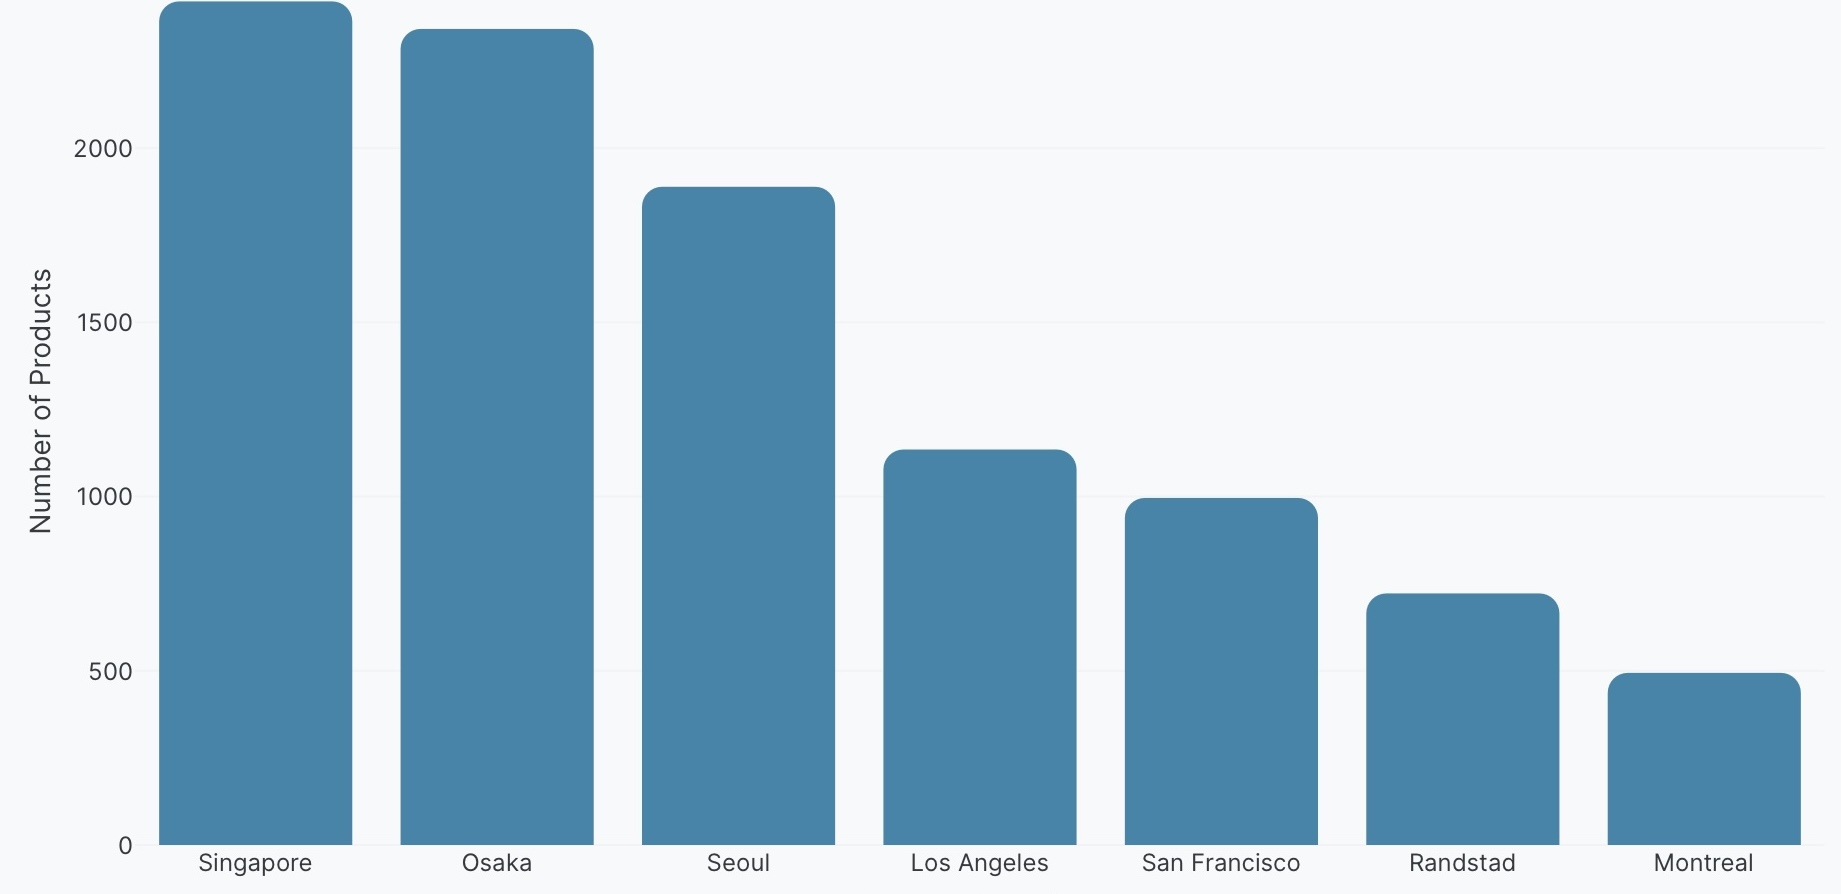
Rounded bars
Create bars with rounded corners for a softer, more modern look.
Create a bar chart of <Y> by <X>. Use rounded corners.
The following example uses this prompt structure with the factory_location column from the built-in Plotly Studio dataset to create bars with rounded corners:
Create a bar chart of count of products by factory location.
Use rounded corners.
Interactive controls
Add dropdowns and other controls to make your bar charts interactive. Controls let users filter and explore the data dynamically.
Create a bar chart of count of products by factory location,
color by delivery location.
Add a dropdown to select delivery location
(All, Montreal, Osaka, Seattle, Singapore) - Default All.
Add a checkbox to toggle between grouped and stacked bars - Default grouped.
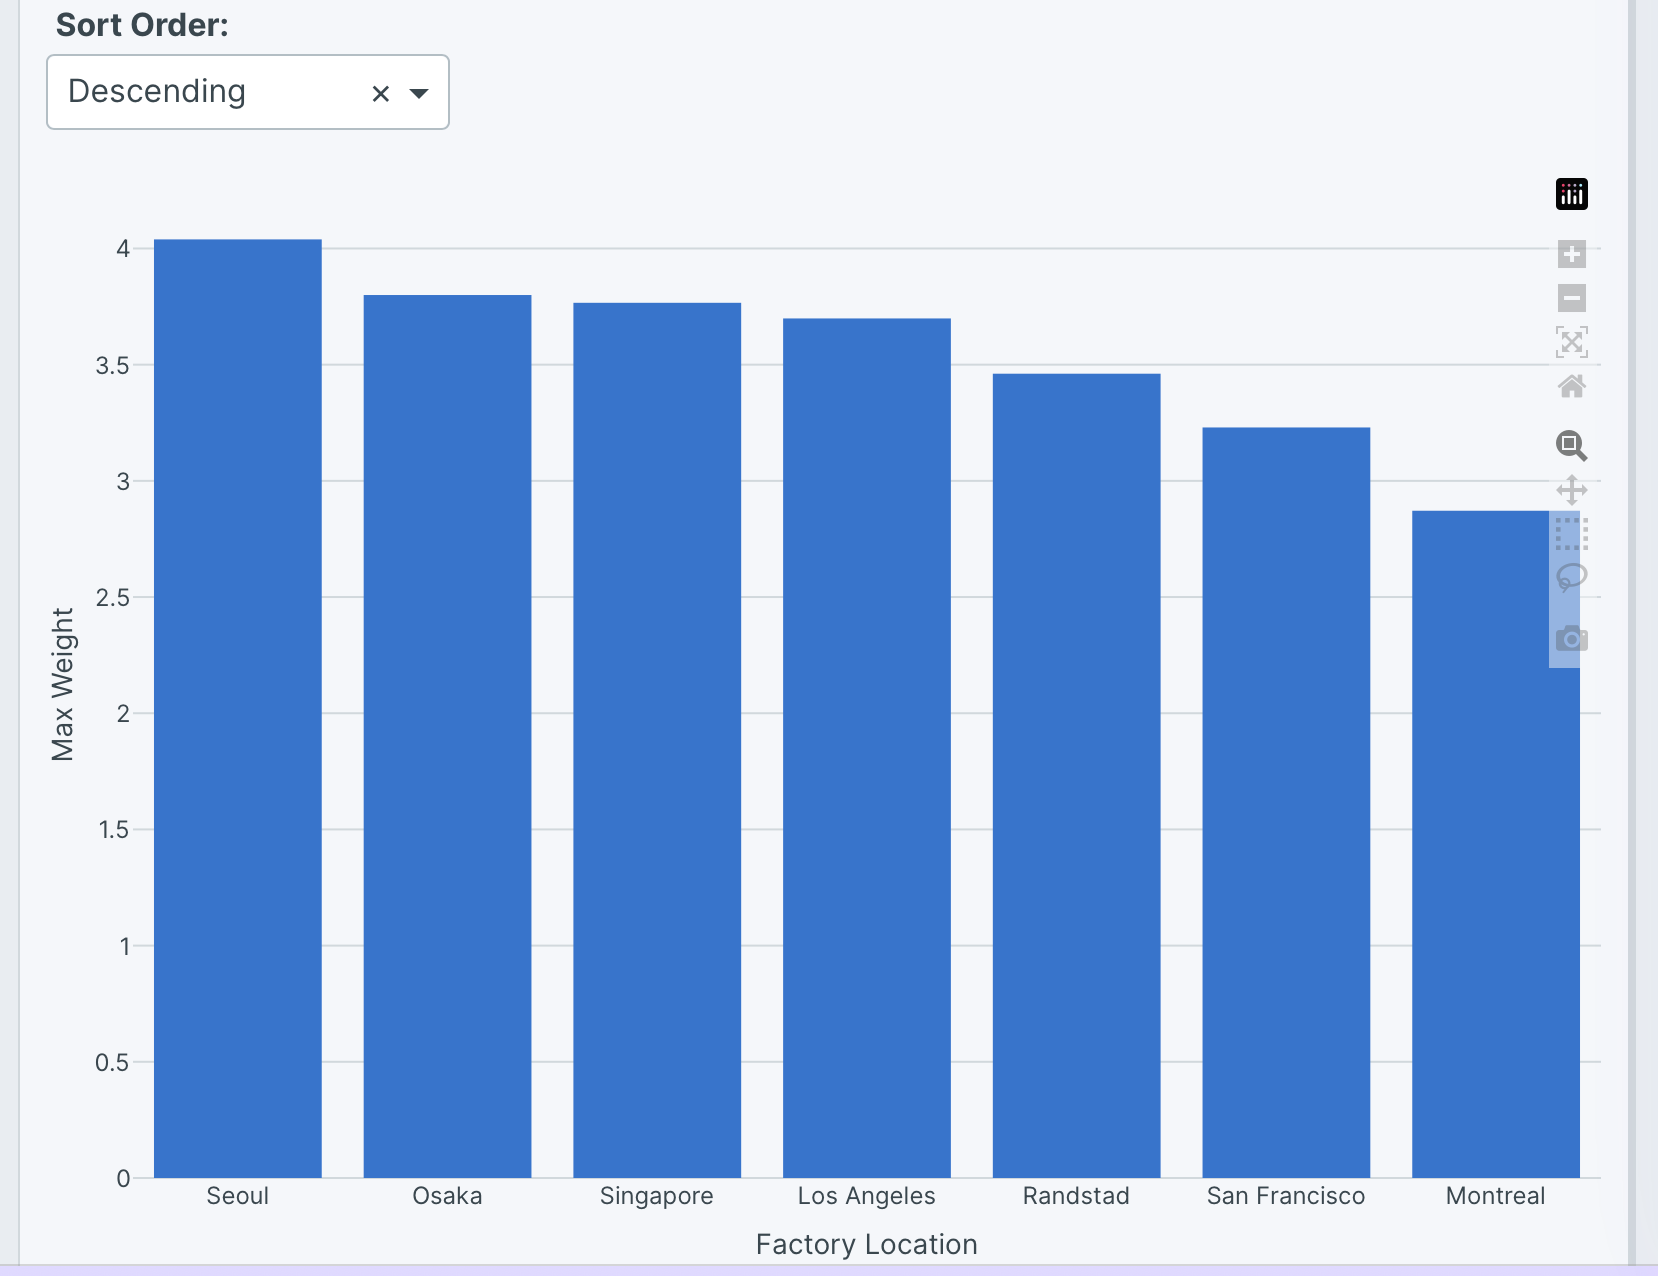
Sorting options
Add a dropdown to let app users change how bars are sorted.
Create a bar chart of <Y> by <X>.
Add a dropdown to select sort order (<options>) - Default <value>.
The following example uses this prompt structure with the weight and factory_location columns from the built-in Plotly Studio dataset:
Create a bar chart of max weight by factory location.
Add a dropdown to select sort order
(Ascending, Descending, Alphabetical) - Default Descending.
Prompt keywords reference
Use these keywords and phrases in your prompts to customize your bar chart.
Chart
Here are some keyword suggestions to create and customize a chart:
| Keyword/Phrase | Description | Example |
|---|---|---|
| X | The variable to show on the horizontal axis | factory location |
| Y | The variable to show on the vertical axis | count of products |
| Color | Color bars by different groups or values | color by delivery location |
| Pattern shape | Map different pattern shapes to categories | use forward diagonal patterns |
| Facet rows | Create multiple plots stacked vertically by group | facet vertically by factory location |
| Facet columns | Create multiple plots side-by-side by group | facet by factory location |
Data
Specify data instructions in your prompt to transform, filter, or aggregate your data before visualization.
Count products by factory location.
Calculate total value as price times quantity.
Here are some keyword suggestions:
| Keyword/Phrase | Description | Example |
|---|---|---|
| Aggregation | Specify how to aggregate data | count products by factory location |
| Computed field | Create new calculated fields from existing data | calculate total value as price times quantity |
| Filter | Filter data to show only specific records | filter to show only defect = true |
Options
Specify options in your prompt to add interactive controls that allow users to dynamically filter, transform, and visualize data without regenerating the chart.
Add a dropdown to select delivery location (All, Montreal, Osaka) - Default All.
Add a checkbox to toggle between grouped and stacked bars - Default grouped.
Here are some keyword suggestions. See App Controls for a complete list of control types and additional examples.
| Keyword/Phrase | Description | Example |
|---|---|---|
| Dropdown | Add a dropdown menu to filter by categories | Add a dropdown to select delivery location (All, Montreal, Osaka) - Default All |
| Checkbox | Add a checkbox to toggle options | Add a checkbox to toggle between grouped and stacked bars - Default grouped |
Chart styles
Specify chart styles in your prompt to control the visual appearance and formatting of your bar chart.
Use custom colors: #FF5733, #33FF57.
Make the chart horizontal.
Use grouped bars.
Show values on bars.
Here are some keyword suggestions:
| Keyword/Phrase | Description | Example |
|---|---|---|
| Custom colors | Specify exact colors for bars | Use custom colors: #FF5733, #33FF57 |
| Highlight | Highlight a specific bar with a different color | Highlight Montreal in red |
| Horizontal orientation | Flip bars to horizontal orientation | Make the chart horizontal |
| Grouped bars | Create bars side-by-side for comparison | Use grouped bars |
| Stacked bars | Stack bars on top of each other | Use stacked bars |
| Text on bars | Display values on the bars | Show values on bars |
| Bar width | Set the width of the bars | Set bar width to 0.8 |
| Rounded corners | Create bars with rounded corners | Use rounded corners |
| Patterns | Add patterns to bars. Supported: forward diagonal, backward diagonal, vertical lines, horizontal lines, cross hatch, plus/grid, dots, or solid | Use forward and backward diagonal patterns |
| Hover text | What to show when hovering over bars | Show factory location on hover |
| Axis labels | Customize the text shown on the axes | Label x-axis as "Factory"Label y-axis as "Product Count" |
| Background color | Set the background color of the plot | Set background color to lightblue |
| Grid lines | Show or hide grid lines on the plot | Hide grid lines |
| Color scale | Specify color scale for continuous color mapping. See built-in color scales | Use Viridis color scale |
| Rotate axis labels | Rotate x-axis labels to prevent overlapping | Rotate x-axis labels 45 degrees |
| Sort | Sort bars in ascending or descending order | Sort bars descending |
| Opacity | How see-through the bars are (0=invisible, 1=solid) | Set opacity to 0.5 |
| Axis range | Set minimum and maximum values for axes | Set y-axis range from 0 to 3000 |
| Legend | Control legend display and position | Show legend at top right |